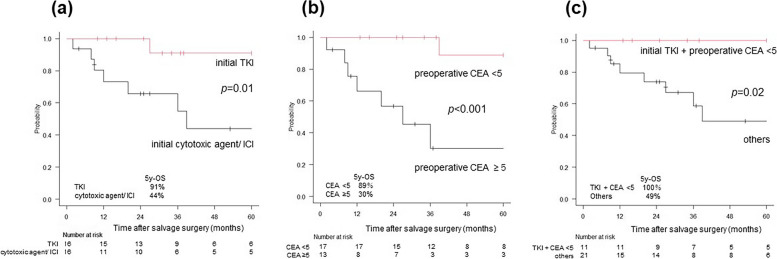
Fig. 3.
OS curves in patients after salvage surgery. The patients were stratified by prior drug treatment (TKI or others) and preoperative CEA level (CEA < 5 or ≥ 5 ng/mL). a OS curves stratified by prior drug treatment. The 5-year OS rates are 91% and 44% in the TKI and cytotoxic agents or ICI groups, respectively. There is a significant difference between them (p = 0.01). b OS curves stratified by preoperative CEA level. The 5-year OS rates are 89% and 30% in the CEA < 5 and CEA ≥ 5 ng/mL groups, respectively. There is a significant difference between them (p < 0.001). c OS curves stratified by the two prognosticators of OS (prior drug treatment and preoperative CEA level). The 5-year OS rates are 100% and 49% in the prior TKI therapy plus CEA < 5 ng/mL group and the others, respectively. There is a significant difference between them (p = 0.02). CEA, carcinoembryonic antigen; ICI, immune checkpoint inhibitor; OS, overall survival; TKI, tyrosine kinase inhibitor

