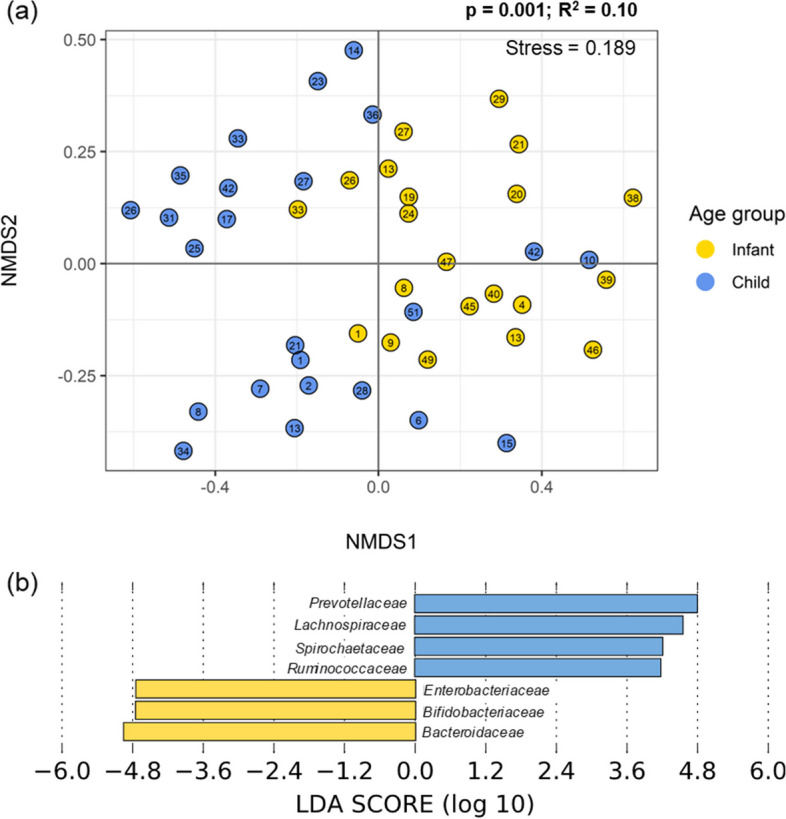
Fig. 2.

Differences in child and infant gut microbiomes. a Beta diversity of infants (yellow, ages 0–1.99) and children (blue, ages 2–6), plotted with Non-Metric Multi-dimensional Scaling (NMDS) ordination based on Bray Curtis dissimilarity. The number in each point indicates the household in which the sample was collected. The difference between children and infants was significant via PERMANOVA tests (p = 0.001); b Bacterial families with different abundances in children and infants were identified with linear discriminant analysis effect size (LEfSe). Families in blue were more abundant in children and families in yellow were more abundant in infants
