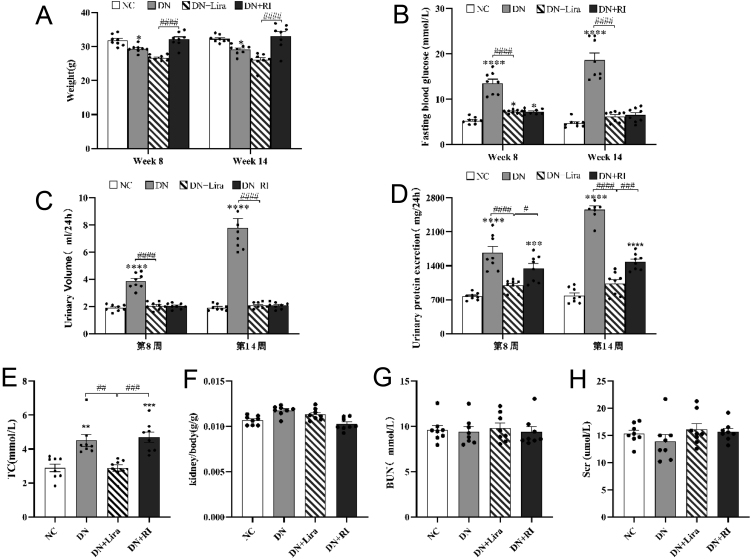
Figure 2.
Physiological and biochemical index results of each group of mice: (A) body weight; (B) fasting blood glucose; (C) 24-h urine volume; (D) 24-h urinary protein; (E) total cholesterol; (F) kidney weight/body ratio; (G) serum urea nitrogen; and (H) serum creatinine. *P < 0.05, **P < 0.01, ***P <0.001, ****P <0.0001 vs NC; #P < 0.05, ##P < 0.01, ###P < 0.001, ####P < 0.0001 vs DN + Lira.

 This work is licensed under a