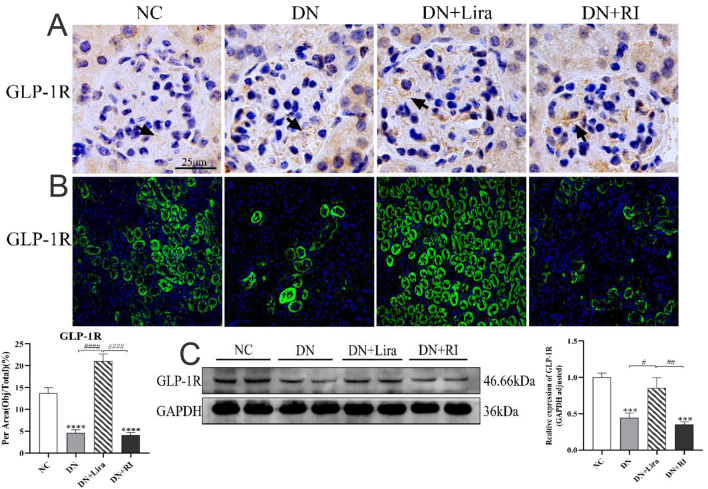
Figure 5.
Changes in the expression site and amount of GLP-1R in the kidney of each group of mice. (A) Immunohistochemical method to observe the expression of GLP-1R protein in mouse glomeruli. (B) Immunofluorescence was used to observe and semi-quantitatively analyze the expression of GLP-1R protein in mouse kidney. (C) Western blot semiquantitative analyses of the expression level of GLP-1R protein in mouse kidneys. *** P < 0.001, ****P <0.0001 vs NC; #P < 0.05, ##P < 0.01, ####P < 0.0001 vs DN + Lira.

 This work is licensed under a