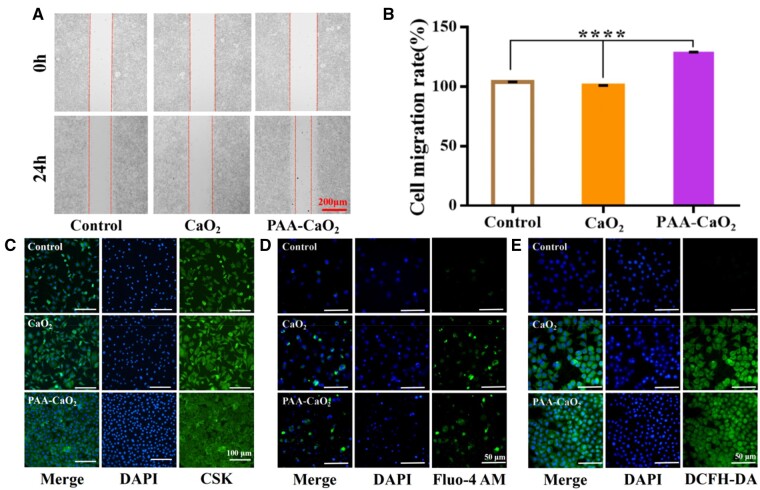
Figure 4.
In vitro migration, proliferation assays and intracellular Ca2+ and ROS detection assays of L929 cells. (A) Migration assay and (B) corresponding statistical analysis by ImageJ (****P < 0.0001). (C) Fluorescence characterization of cell proliferation images. Schematic diagram of intracellular Ca2+ (D) detection and ROS (E) detection, respectively.

