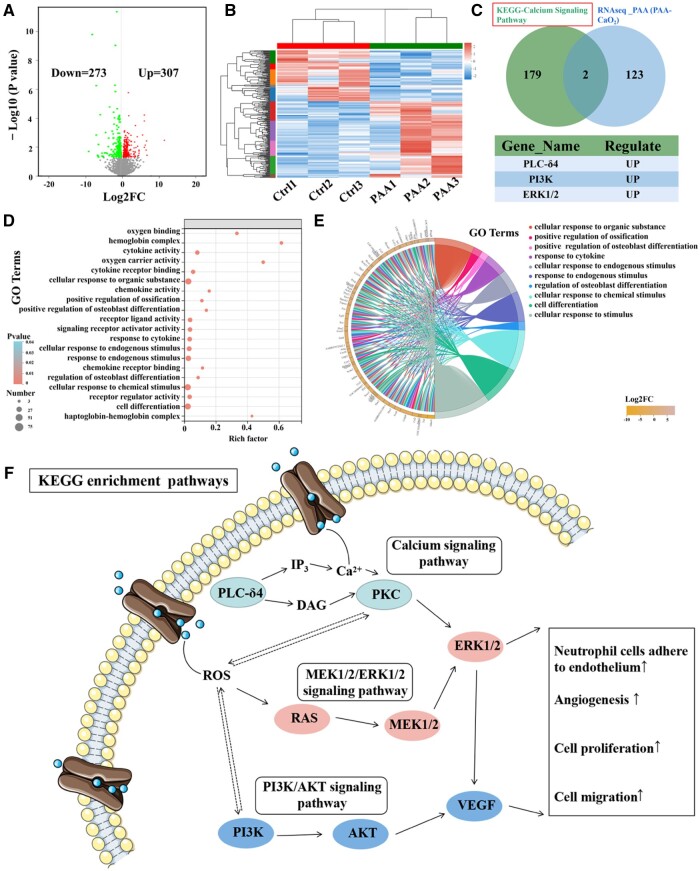
Figure 6.
Transcriptomic analysis of rats treated with normal saline (control, ctrl) and PAA-CaO2 nanoparticles (PAA). (A) Volcano plot of RNA-seq data of wound in the two groups calculated by DESeq2 (n = 3 per group). (B) Heat map of DEGs between the two groups (n = 3 per group). (C) Venn analysis to screen hub genes involved in enrichment analysis and up-regulated DEGs. (D) GO bubble plot and (E) GO chord plot of GO enrichment analysis, displaying the relationship between genes and GO terms. (F) The KEGG enrichment pathway diagram of PAA-CaO2 nanoparticles enhances calcium, PI3K/AKT and MEK1/2/ERK1/2 signals to regulate wound healing processes. PLC-δ4, phospholipase C Delta 4; DAG, diacylglycerol; IP3, inositol 1, 4, 5-trisphosphate; PKC, protein kinase C; PI3K, phosphoinositide 3-kinase; AKT, protein kinase B; MEK1/2, mitogen-activated protein kinase kinase (MAPKK); ERK1/2, extracellular signal-regulated kinase; VEGF, vascular endothelial growth factor.

