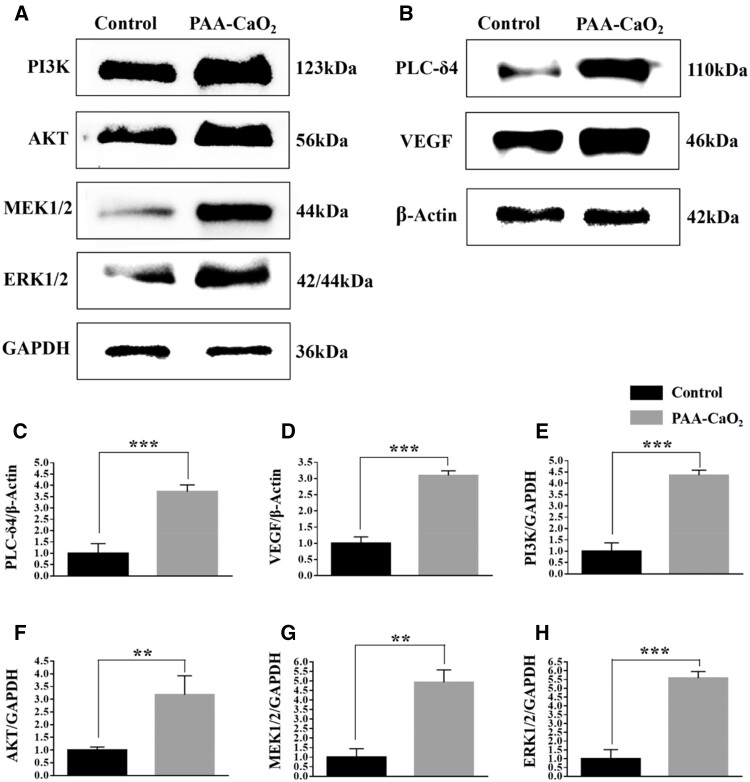
Figure 7.
The protein expression level of the control and PAA-CaO2 nanoparticles treatment groups on Day 7. The PI3K, AKT, MEK1/2, ERK1/2 (A) and the PLC-δ4, VEGF (B) expression of the wound after incubation with different formulas. Quantification of PLC-δ4 (C), VEGF (D), PI3K (E), AKT (F), MEK1/2 (G) and ERK1/2 (H) expression level by ImageJ (**P < 0.01, ***P < 0.001).

