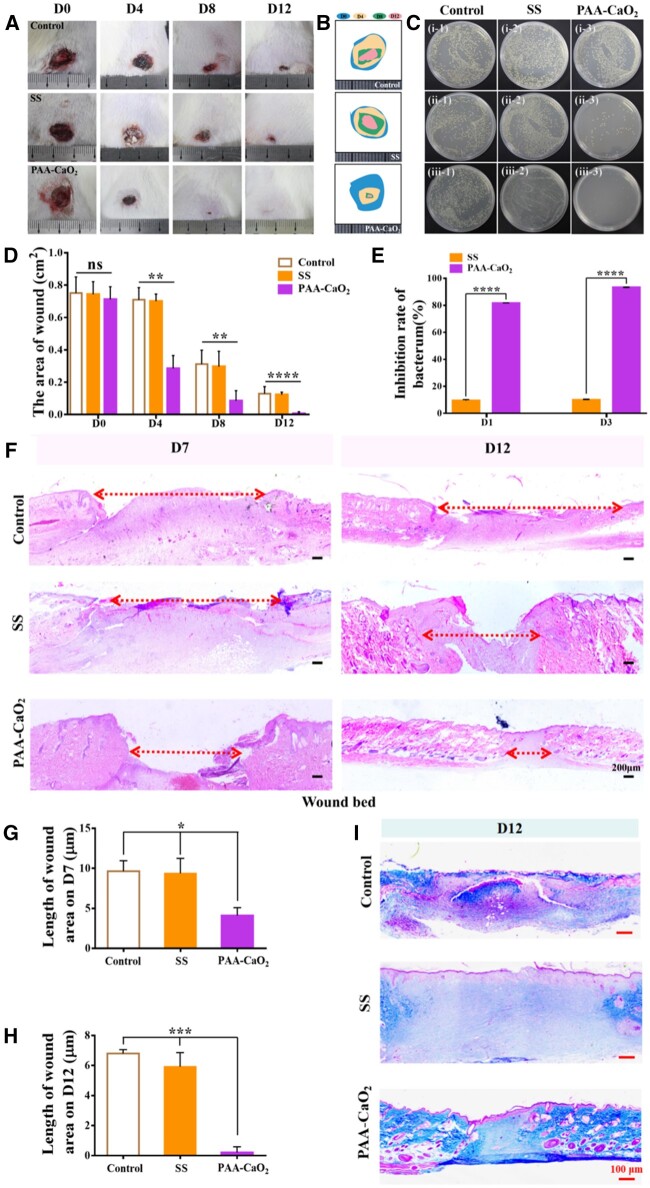
Figure 8.
(A) Overview of the size change of S.aureus-infected wound status at 0, 4, 8 and 12 days after treating with normal saline (control), SS and PAA-CaO2 nanoparticles differently. Relative area diagram (B) and statistics (D) of the wound. (C) Infected wounds exudate bacterial colony culture coated plate after being treated with different formulas to post S.aureus-inhibition rate: (i) Day 0 (12 h after infection); (ii) Day 1; (iii) Day 3. (E) Quantitative analysis of the exudate bacterial colony in the wound by ImageJ. (F) H&E staining of the wound bed at 7 and 12 days. Corresponding statistics of wound bed length in H&E staining at 7 (G) and 12 (H) days. (I) The collagen deposition on Day 12 (ns: non-significant, *P < 0.05, **P < 0.01, ***P < 0.001, ****P < 0.0001).

