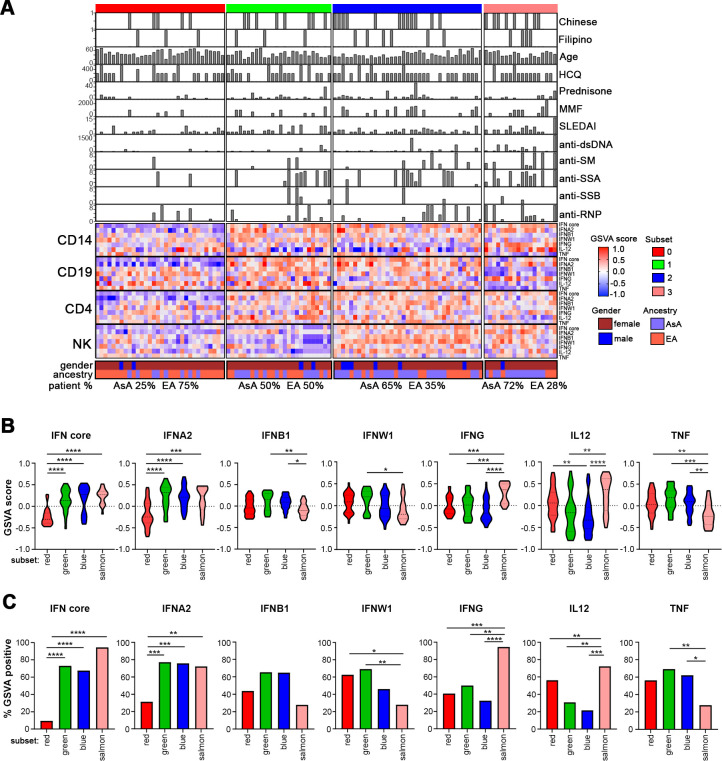
Figure 1.
Patient subsets are defined by differential IGS enrichment. (A) K-means clustering of IFN GSVA enrichment scores from 113 patients with SLE across four cell types. The complex heatmap shows patient-by-patient variation in seven IGSs along with ancestry, age, SLEDAI, medications and autoantibody titre. Hydroxychloroquine is abbreviated as HCQ and mycophenolate mofetil is abbreviated as MMF. The distribution of AsA and EA patients in each subset is also shown. (B) Violin plots of GSVA scores of the seven different interferon modules in each of the four patient subsets within monocytes. Significance measures are as follows: *p<0.05, **p<0.01, ***p<0.001, ****p<0.0001 determined by Welch’s t-test. The red subset contains 32 patients, the green subset contains 26 patients, the blue subset contains 37 patients and the salmon subset contains 18 patients. (C) Bar plots showing the percentage of patients in each subset that are GSVA positive for the various IGSs within monocytes. Statistical significance is shown using a χ2 test of proportion. AsA, Asian ancestry; EA, European ancestry; GSVA, gene set variation analysis; IFN, interferon; IGS, interferon gene signature.

