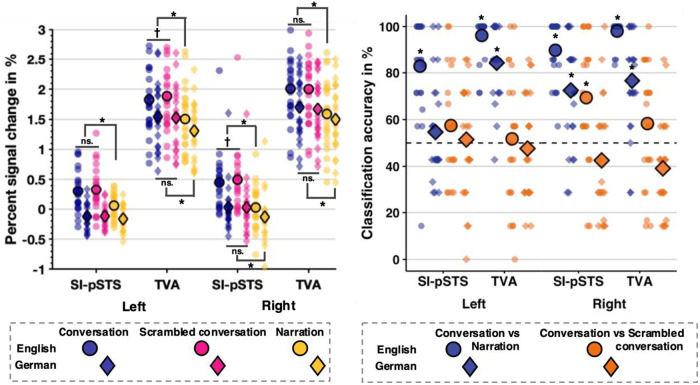
Fig. 1.
Condition means (circle/diamond shape with bold edge) and data distribution dot plot for each ROI and hemisphere for Experiment 1. Left panel: Percent signal change data. Only significant post hoc t-test results are marked (*: p < .0125 corrected, †: p < .05 uncorrected). Effects for English conditions are shown above, and for German conditions below the condition mean. Right panel: SVM classification accuracy. Significant above chance classification accuracy is indicated using an asterisk (*: p < .05 TFCE-corrected). Chance level of 50% is represented using the dashed horizontal line.

