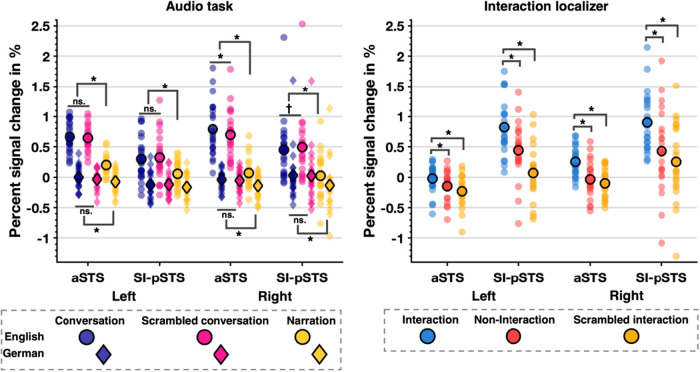
Fig. 4.
Percent signal change data displaying condition means (circle with bold edge) and data distribution for each aSTS and SI-pSTS ROI by hemisphere for audio task (left panel) and interaction localiser (right panel). Please note that pSTS data for the audio task is the same as in Figure 1 and for the interaction localiser is the same as Figure 2. Significant post hoc t-test results are marked by an asterisk (*: p < .0125 corrected, †: p < .05 uncorrected).

