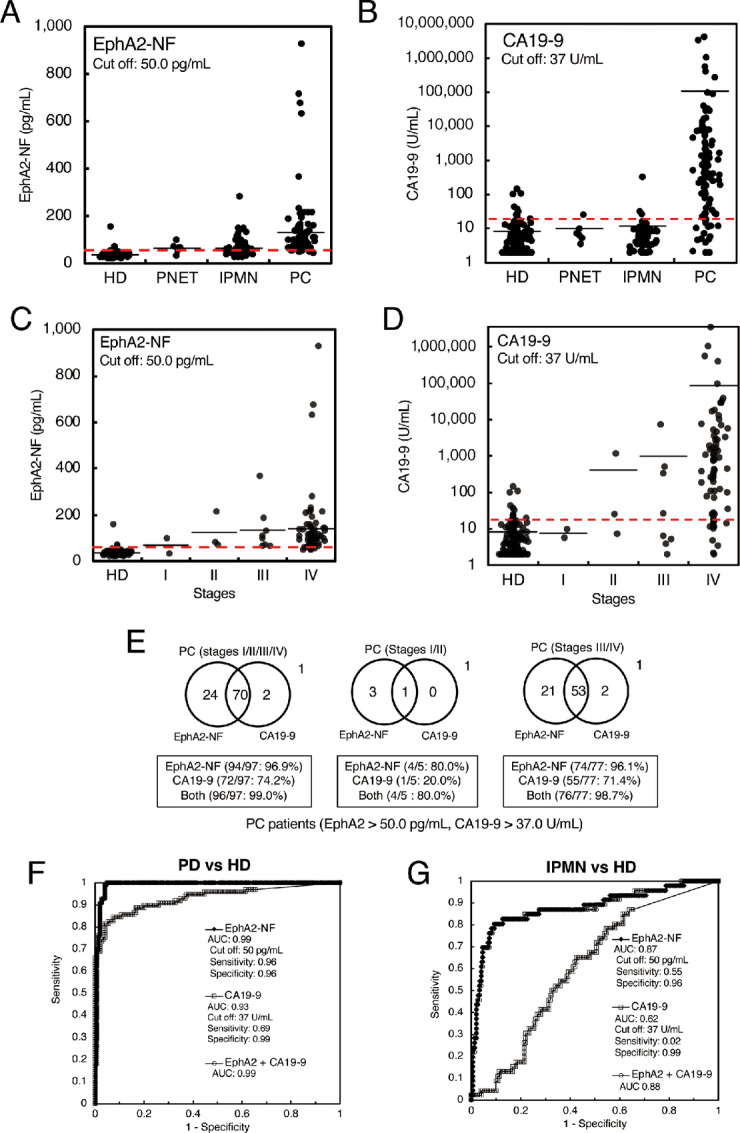
FIGURE 2.

Diagnostic performance of EphA2-NF and CA19-9 for pancreatic cancer in the test cohort. Dot plots of serum EphA2-NF (A) and CA19-9 (B) levels from 150 HDs, and 6 patients with PNETs, 46 patients with IPMNs, and 97 patients with pancreatic cancer in the test cohort. The cut-off value for EphA2-NF was defined at 50.0 pg/mL (mean + 1 SD of HDs). The cut-off value of CA19-9 was set at 37 U/mL. Dot plots of EphA2-NF (C) and CA19-9 (D) levels in pancreatic cancer sera from the test cohort by stage. In this analysis, 82 cases of pancreatic cancer with staging information were utilized. E, Venn diagrams of EphA2-NF and CA19-9 in patient sera with pancreatic cancer (left, stage I/II/III/IV), early-stage pancreatic cancer (center, stage I/II), and late-stage pancreatic cancer (right, stage III/IV). F, ROC curves of serum EphA2-NF and CA19-9 for differentiating between pancreatic cancer and HDs. G, ROC curve of serum EphA2-NF and CA19-9 for differentiating IPMN and HDs.
