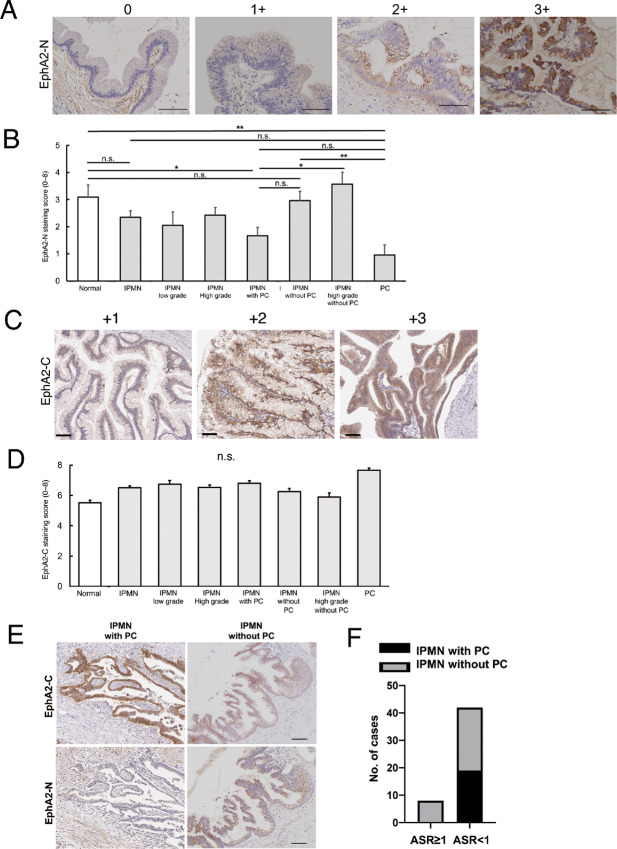
FIGURE 6.
IHC of the EphA2 cleavage state in IPMN with and without pancreatic cancer. A, Representative images of IPMN cells stained for the EphA2 N-terminus. 0, no staining; 1+, weakly positive staining; 2+, moderately positive staining; 3+, strongly positive staining. Scale bar: 100 μm. B, EphA2 N-terminus staining scores in normal (n = 67), IPMN (n = 89), low-grade IPMN (n = 19), high-grade IPMN (n = 70), IPMN with pancreatic cancer (n = 42), IPMN without pancreatic cancer (n = 47), high-grade IPMN without pancreatic cancer (n = 42), and pancreatic cancer (n = 25). ns, no significance; *, P < 0.05; **, P < 0.01; ***, P < 0.001. C, Representative images of IPMN tissues stained for the EphA2 C-terminus. 0, no staining; 1+, weakly positive staining; 2+, moderately positive staining; 3+, strongly positive staining. Scale bar: 100 μm. D, EphA2 C-terminus staining scores in normal (n = 67), IPMN (n = 89), low-grade IPMN (n = 19), high-grade IPMN (n = 70), IPMN with pancreatic cancer (n = 42), IPMN without pancreatic cancer (n = 47), high-grade IPMN without pancreatic cancer (n = 42), and pancreatic cancer (n = 25). E, Representative images of IPMN with or without pancreatic cancer stained for the EphA2 N- or C-terminus. Scale bar: 50 μm. F, Statistical analysis of the ASR of IPMN with and without pancreatic cancer. The χ2 test was performed. n.s., no significance.

