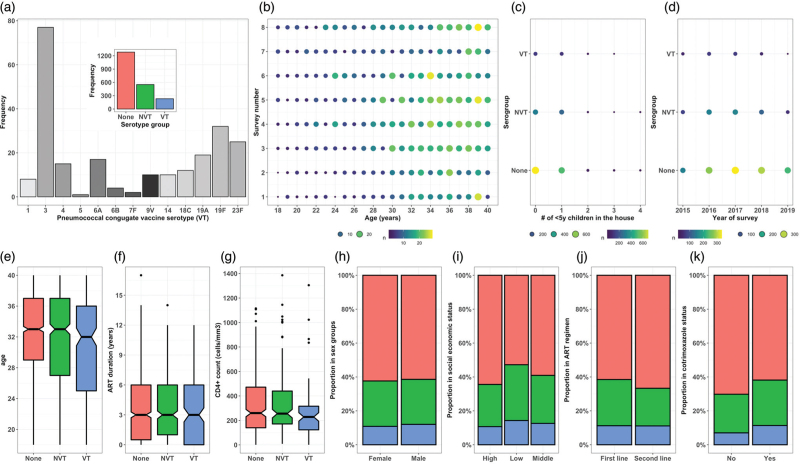
Fig. 1.
Demographics and clinical characteristics of participants using aggregated data across eight surveys.
(a) Frequency of each VT in carriage; insert shows frequency of VT, NVT and no carriage. (b) Number of adults in each annual age per survey with circle size proportional to total sample size. The number of adults with VT, NVT and no carriage living with (c) varying number of children less than 5 years or (d) across survey years. Notched box plots by serotype group representing participant distribution by (e) age, (f) duration on ART and (g) CD4+ count. Proportion of serotype group by (h) sex, (i) social economic status, (j) ART regimen and (k) Cotrimoxazole use.

