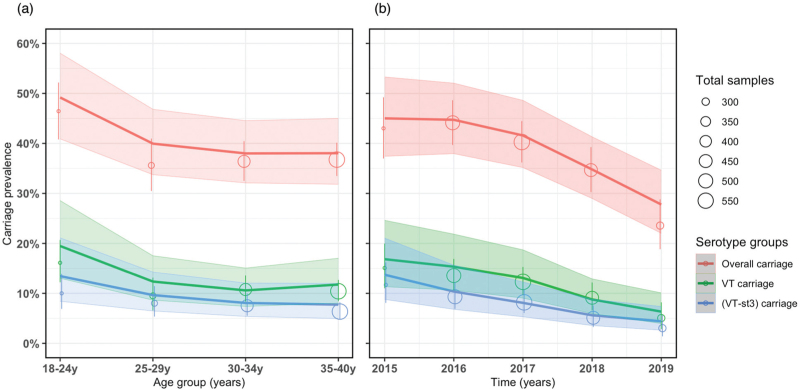
Fig. 2.
Observed and fitted pneumococcal carriage prevalence curves using data from rolling, prospective cross-sectional surveys in Blantyre, Malawi 2015–2019.
Number of carriage samples per age group between 18 and 40 years (y) and survey time from 2015 to 2019 represented by open circles radius proportion to total sample size with corresponding confidence intervals (vertical lines). P-spline GAM fitted lines and confidence intervals (ribbons) for the (a) age-dependent and (B) time-dependent carriage prevalence stratified by overall carriage, vaccine serotypes (VT) carriage and VT carriage without serotype 3 (VT-st3).

