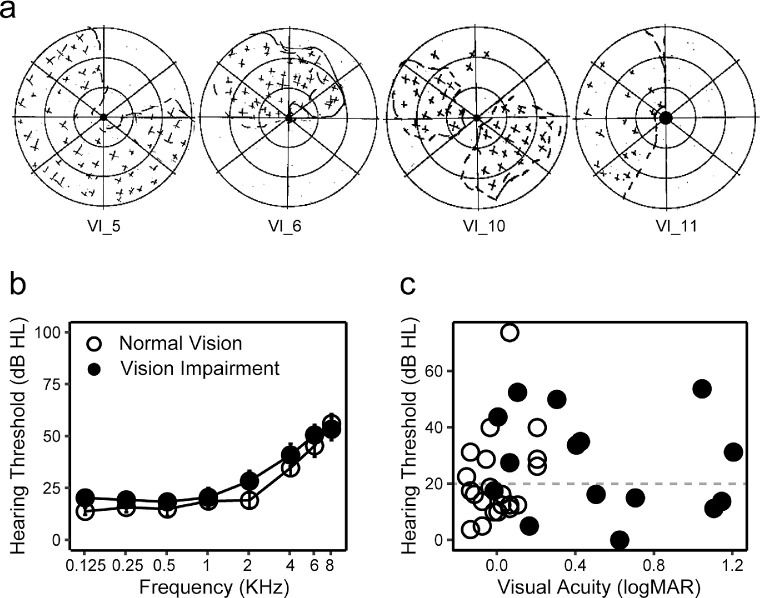
Figure 1.
Vision and hearing status. (a) Examples of the California Central Visual Field Test results from four subjects with central scotomas. The shaded areas represent scotomas. (b) Audiogram of VI (dots) and NV (circles) groups. Pure tone thresholds (dB HL) were plotted as a function of sound frequencies (kHz). (c) Scatter plot showing distributions of acuity (logMAR, x axis) and hearing thresholds (dB HL, y axis) for each individual subject. Dots and circles represent VI and NV groups, respectively.

