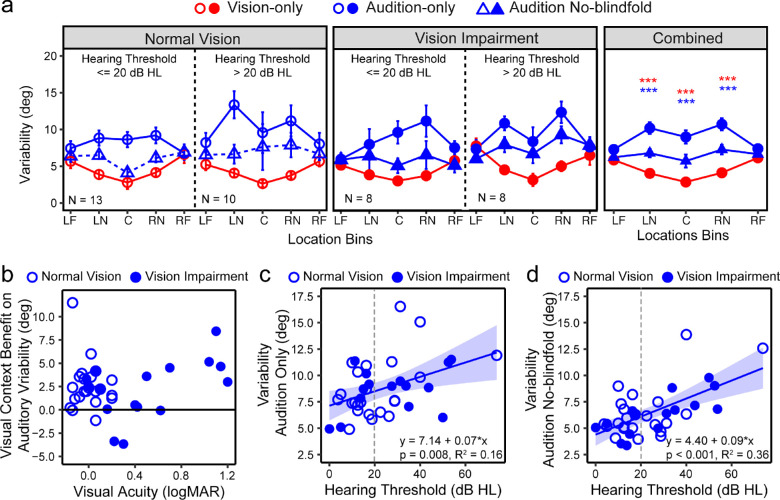
Figure 6.
Localization variability. (a) Variability (in degrees) across the five bins at each condition for the NV group (left), VI group (middle), and all groups combined (right). In each group, results were plotted separately for subjects whose hearing thresholds ≤20 dB HL and >20 dB HL. The error bars represent standard errors. The five bins correspond with −90° to −60° (left far periphery [LF]), −50° to −20° (left near periphery [LN]), −10° to 10° (center [C]), 20° to 50° (right near periphery [RN]), and 60° to 90° (right far periphery [RF]). (d) The visual context benefit on auditory variability, calculated as the difference between the variabilities in the audition-only and audition no-blindfold conditions, as a function of visual acuity. (c and d). The overall variability across all locations in the audition-only (b) and audition no-blindfold (c) conditions as functions of hearing thresholds. Open and closed circles represent the NV and VI groups, respectively. A vertical dashed lines mark out 20 dB HL. Regression lines and the equations are also noted. This is the overall benefit across all five bins. ***P < 0.001.

