
Figure 1.
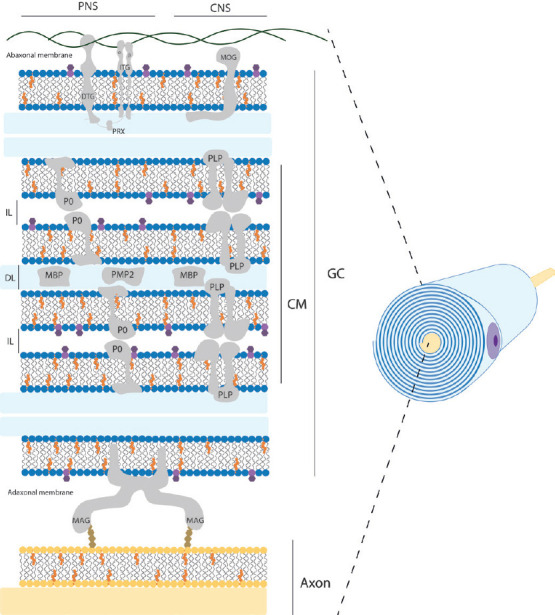
Schematic structural view of myelin sheath in the nervous system.
This representation shows a simplified distribution of the main components within myelin sheath in PNS and CNS. Residual intracellular space remaining of the glial cell is colored blue and corresponds to DL. The extracellular space between adjacent layers of the spiral corresponds to IL. Mayor lipid components are shown as cholesterol molecules in orange; phospholipids head in blue color; galactose residue of galactosylceramide molecule in dark purple. Mayor protein components are represented as CM, GC, DTG, ITG, PRX, MOG, P0, PLP, MBP, PMP2, and MAG. Note that cytoskeletal elements, other common proteins and cell organelles are not included for clarity. Original figure was created by Adobe Illustrator. CM: Compacted myelin; CNS: central nervous system; DL: mayor dense line; DTG: dystroglycan; GC: glial cell membrane; IL: intraperiod line; ITG: integrins; MAG: myelin associated glycoprotein; MBP: myelin basic protein; MOG: myelin oligodendrocyte glycoprotein; P0: myelin protein 0; PLP: proteolipid protein; PMP2: peripheral myelin protein 2; PNS: peripheral nerve system; PRX: periaxin.