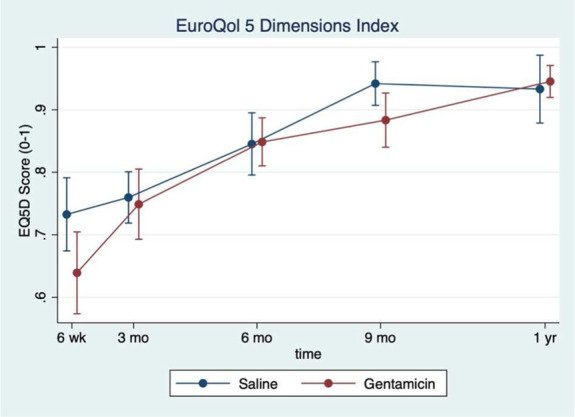
Figure 3.

EuroQol 5 Dimensions (EQ-5D) index over time by treatment group. The mean EQ-5D score plotted over time at each follow-up time point. The saline group is represented by the blue dots while the gentamicin group is represented by the red dots.
