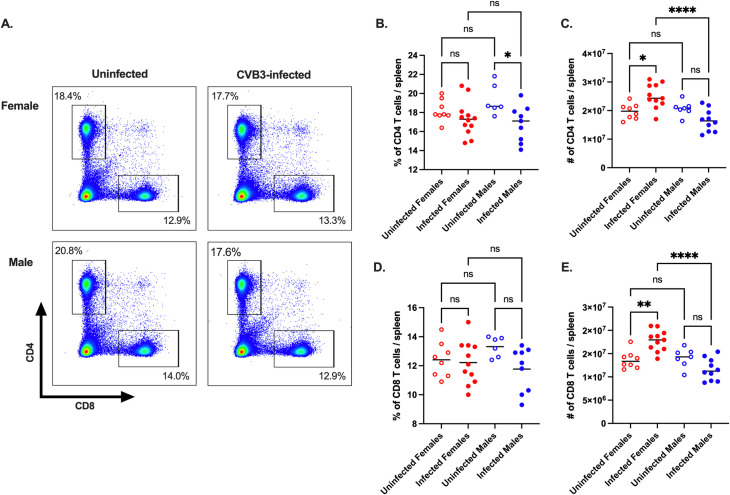
Fig 1. The CD4+ and CD8+ T cell response in CVB3-infected male and female Ifnar-/- mice.
Male and female Ifnar-/- mice were orally inoculated with 5x10⁷ PFUs of CVB3. The spleen was harvested at 5dpi, and splenocytes were processed for analysis by flow cytometry. (A) Representative flow cytometry plots of T cells gated on CD4+ and CD8+ T cell expression in uninfected and infected male and female mice. The frequency (B) and number (C) of splenic CD4+ T cells 5dpi. The frequency (D) and number (C) of splenic CD8+ T cells 5dpi. Data points in the scatter plots represent individual mice, with lines representing the mean from two experiments. *p<0.05, **p<0.01, ****p<0.0001, One-way ANOVA.

