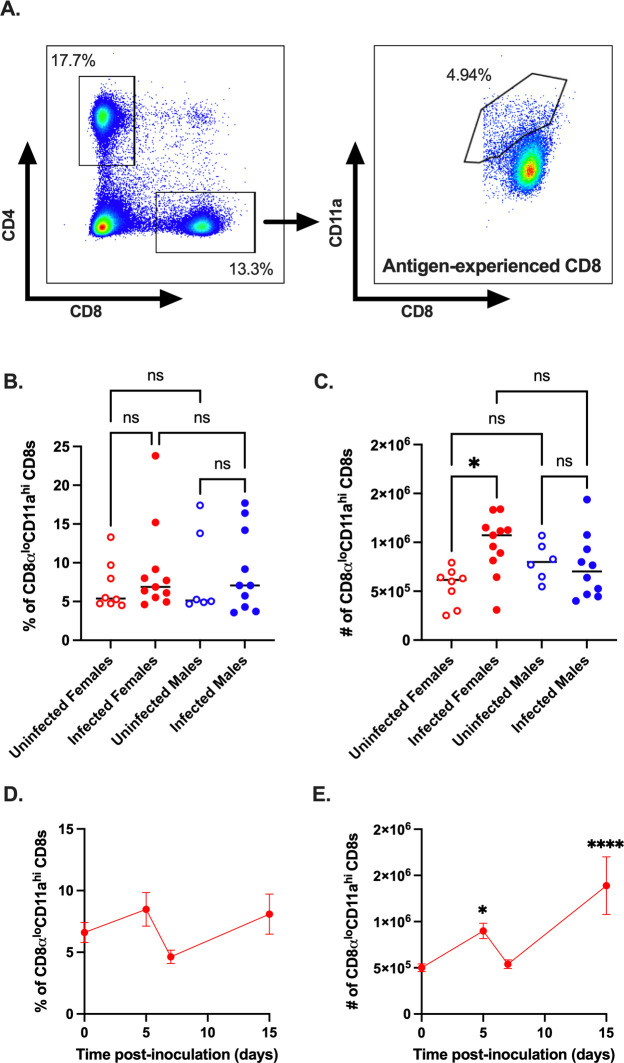
Fig 4. CVB3 induces expansion of antigen-experienced CD8+ T cells.
(A) Representative flow cytometry plots for the gating strategy of CD8αloCD11ahi expression on CD8+ T cells. The frequency (B) and number (C) of CD8αloCD11ahi CD8+ T cells in male and female Ifnar-/- mice 5dpi. Data points in the scatter plots represent individual mice, with lines representing the mean from two experiments. *p<0.05, One-way ANOVA. The kinetics of the frequency (D) and number (E) of CD8αloCD11ahi CD8+ T cells in female Ifnar-/- mice from the spleen. All data are from two-three independent experiments with n = 7–14 mice per time point and are shown as mean ± SEM. *p<0.05, ****p<0.0001, unpaired t-test.

