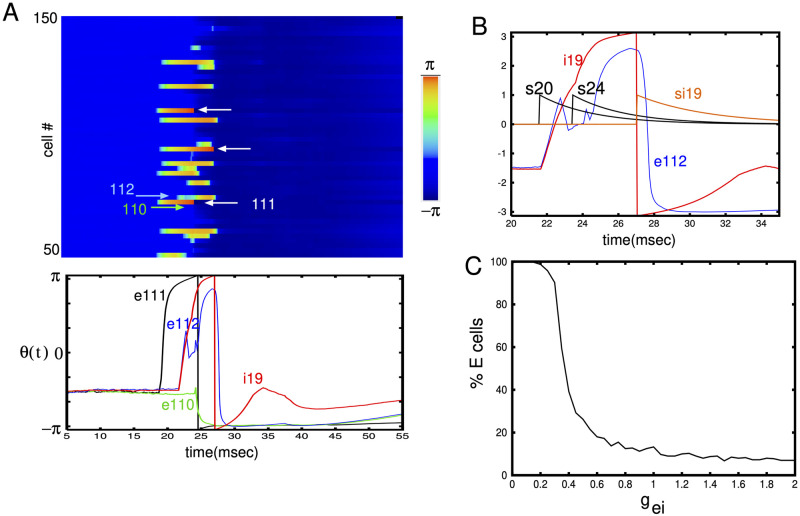
Fig 4.
(A) Subthreshold dynamics (θj(t)) for gei = 1 for the simulation shown in Fig 3. Cells that reached π (and fired) are indicated by the white arrows in the top panel. In the lower panel, time series of excitatory cells #110,#111,#112 and inhibitory cell #i19. (B) Expanded view showing how inhibition from cell #i19 blocks the ability of excitatory cell # e112 to generate a spike. The synapse from excitatory cell # 20 initiates both cells # i19 and # e112 but a second input to # i19 (s24) accelerates the spiking of # i19 allowing it to block # e112. (C) Fraction of excitatory cells participating in the wave as a function of gei.

