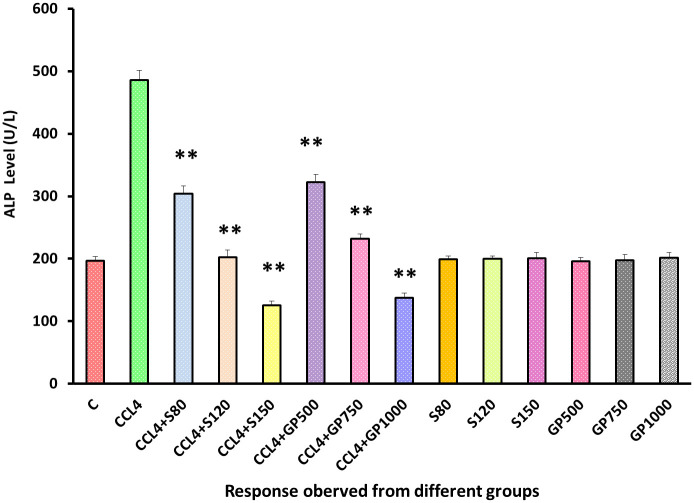
Fig 4. Effect of various treatment specimens on the ALP level of CCl4- treated rats.
Comparison of ALP level (U/L) of rats, belonged to 14 groups just before sacrifice. Each group consist of 10 rodents each with equal body mass index. The data were expressed as mean±standard deviation. X axis represents the group distribution and y-axis represents ALP level of different groups. All abbreviation of different groups has been mentioned in Table 1. (*indicates statistically significant change where p<0.05, correlation is significant at a 95% confidence interval and **indicates highly significant change where p<0.01, correlation is significant at a 99% confidence interval).

