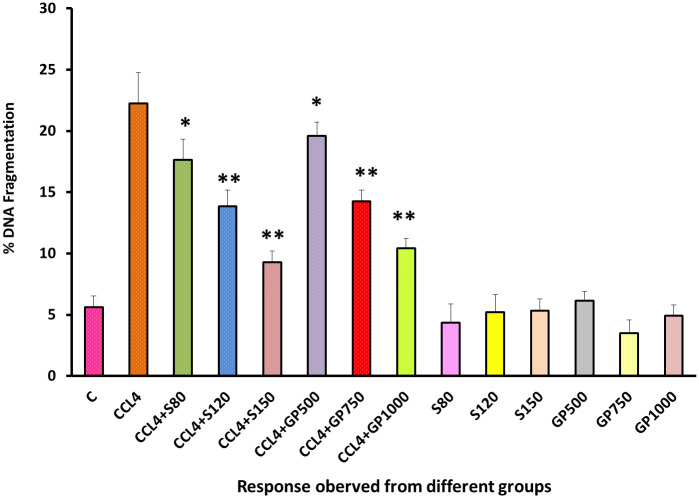
Fig 11. Effect of various treatment specimens on the DNA fragmentation of CCl4- treated rats.
Comparison of DNA fragmentation level of rats, belonged to 14 groups just before sacrifice. Each group consist of 10 rodents each with equal body mass index. The data were expressed as mean±standard deviation. X-axis represents the group distribution and y-axis represents LDH level of different groups. All abbreviation of different groups has been mentioned in Table 1. (*indicates statistically significant change where p<0.05, correlation is significant at a 95% confidence interval and **indicates highly significant change where p<0.01, correlation is significant at a 99% confidence interval).

