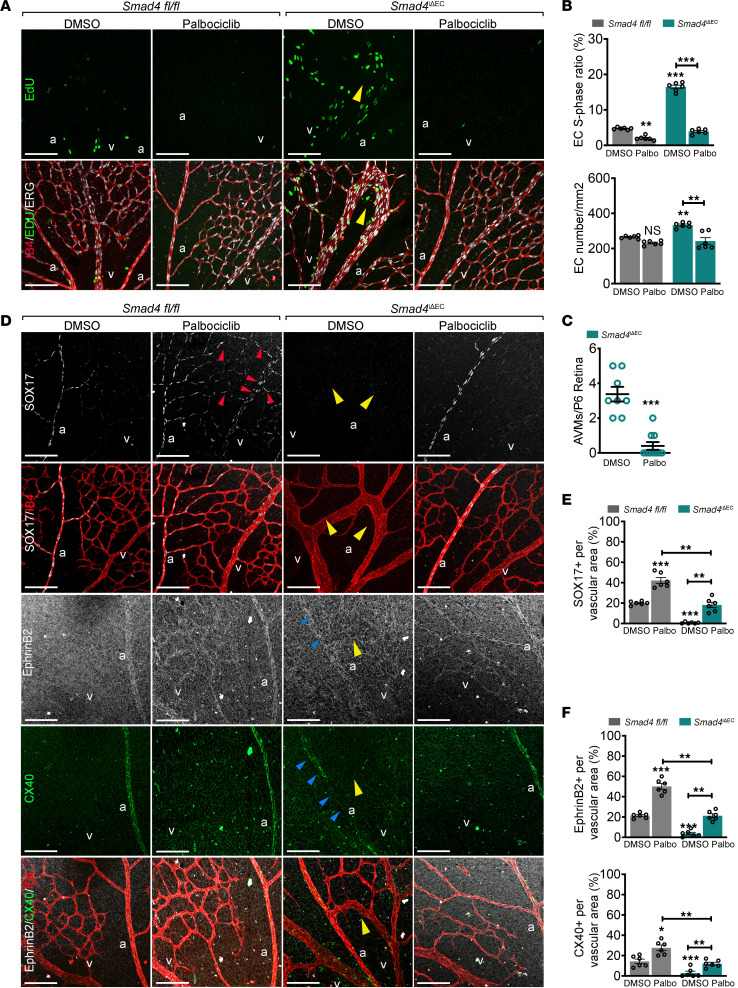
Figure 8. G1 arrest restores arterial identity and rescues AVM formation.
(A) Confocal images of P6 Smad4fl/fl and Smad4iΔEC retinas treated with DMSO or Palbociclib labeled for EdU (green; upper panel) and EdU (green), ERG (white) and IB4 (red) (lower panel). (B) Quantification of the number of EdU+/ERG+ ECs per total number of ERG+ ECs (%) and the total number of ECs. (C) Quantification of the number of AVMs in the vascular plexus from indicated genotypes. (D) Representative confocal images of retinas stained for SOX17 (white) and IB4 (red), and EphrinB2 (white), CX40 (green), and IB4 (red) from the indicated genotypes, DMSO versus Palbociclib treated. (E and F) Quantification of SOX17 (E), EphrinB2, and CX40 signals (F) per vascular area in the plexus of Smad4iΔEC retinas DMSO versus Palbociclib treated (n =6 images/3 retina/group). Yellow arrows in A and D mark AVMs. Red and blue arrows in D point to gain (red) and loss (blue) of SOX17, Ephrinb2, and CX40 expression in vascular plexus. Scale Bars: 100μm in A and D. a, artery; v, vein. Mann-Whitney test (C). 1-way Anova (B, E, and F) were used to determine statistical significance. Data are represented as mean ± SEM. *P < 0.05, **P < 0.01, ***P < 0.001.

