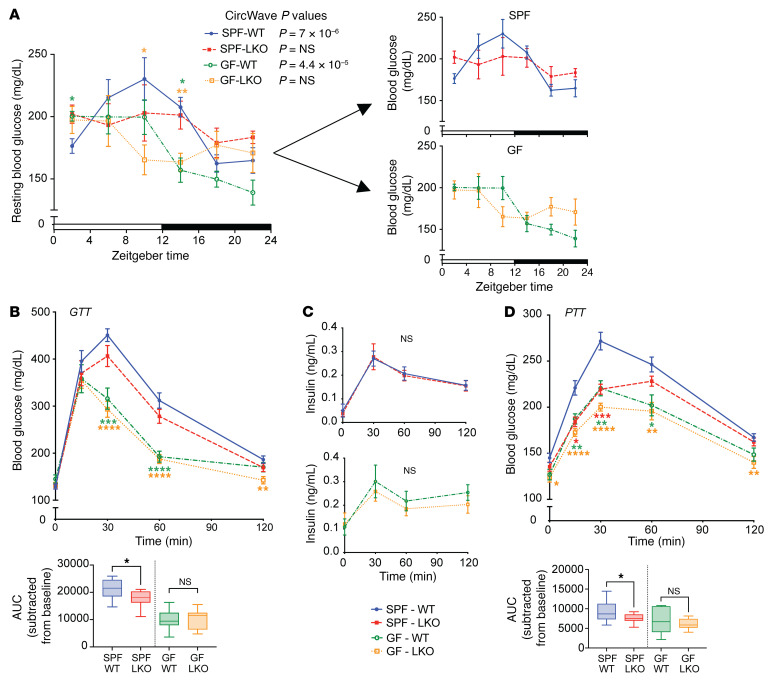
Figure 1. Gut microbes are essential for liver circadian clock–mediated glucose metabolism.
(A) Resting blood glucose levels of SPF and GF WT and LKO male mice every 4 hours over 24 hours (n = 4-6/group/time point, SPF and GF groups also shown separately). CircWave statistics indicate significantly oscillating (P < 0.05) or not oscillating (P > 0.05) values. (B) GTT of SPF and GF WT and LKO male mice (n = 10–13/group). (C) Circulating insulin levels during GTT (n = 10–13/group). (D) PTT (n = 10–15/group) of SPF and GF WT and LKO male mice. Data are shown as the mean ± SEM. Lines in box plots represent the median, and whiskers represent the minimum and maximum, respectively. Two-tailed unpaired Welch’s t tests was performed between 2 groups; Brown-Forsythe and Welch’s ANOVA followed by Dunnett’s tests was performed between 3 or more groups. *P < 0.05, **P < 0.01, ***P < 0.001, ****P < 0.0001, relative to SPF WT. Graphs represent AUC normalized to baseline glucose.

