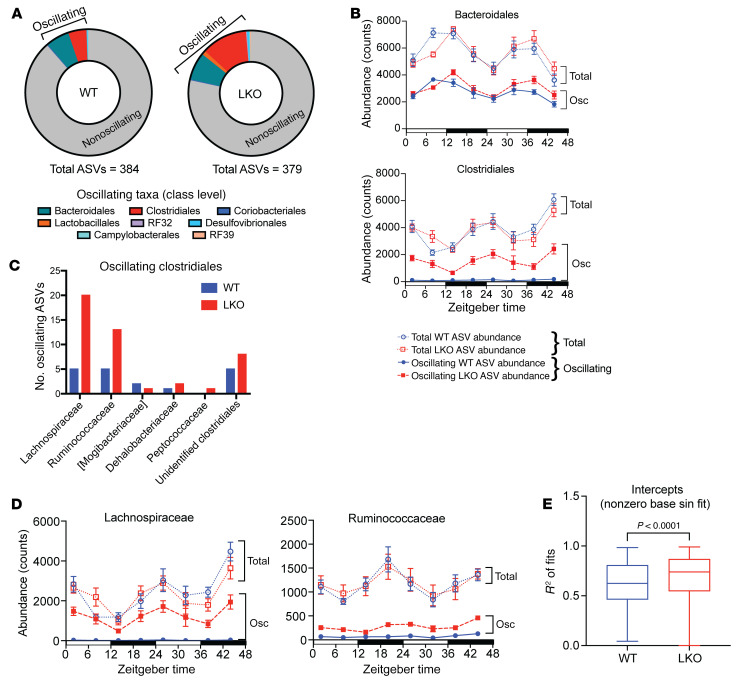
Figure 3. Liver circadian clock drives unique patterns of oscillations in microbial abundance.
16S rRNA gene sequencing of stool from SPF WT and LKO male mice every 6 hours over 48 hours via repeat collection (n = 7–8/group). (A) Proportion of nonoscillating (gray area) versus significantly oscillating (colored areas) amplicon sequence variants (ASVs) identified via eJTK (GammaBH < 0.05). Oscillating (Osc) ASVs were divided by taxonomic class. (B) Abundance counts of total versus oscillating ASVs within Bacteroidales and Clostridiales classes. (C) Number of oscillating Clostridiales ASVs at the family level in WT and LKO mice. (D) Abundance counts of total versus oscillating ASVs within Lachnospiraceae and Ruminococcaceae families. (E) R2 values of nonzero base sinusoidal fits of log ratios at each time point relative to ZT2. Data represent mean ± SEM. Lines in box plots represent the median, and whiskers represent the minimum and maximum, respectively. Two-tailed paired t test was performed.

