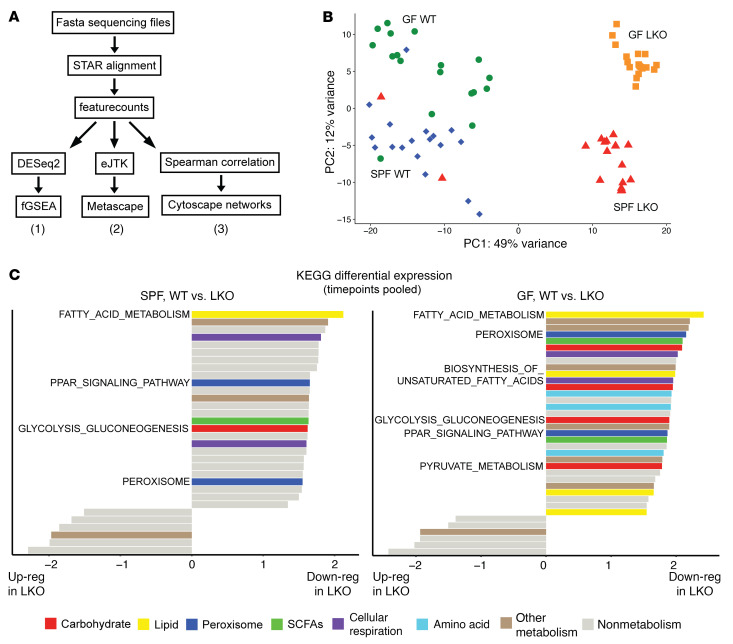
Figure 4. Metabolic pathway gene expression is downregulated in absence of a liver clock across time, regardless of microbial status.
Transcriptome analysis of liver samples collected every 4 hours over 24 hours (ZT2, -6, -10, -14, -18, and -22) from SPF and GF WT and LKO male mice (n = 3/time point/group). (A) Data analysis workflow, demonstrating 3 arms of analysis: 1, differential expression; 2, oscillation; and 3, network coexpression. (B) Principal component analysis of transcriptome profiles; all samples within each group were pooled. (C) Differentially regulated KEGG pathways between WT and LKO mice within SPF and GF groups; all samples within each group were pooled. Metabolic pathways are colored (see key),and nonmetabolic pathways are colored gray. Bars to the right of the midline plot represent pathways downregulated in LKO mice compared with WT mice; bars to the left represent pathways upregulated in LKO mice compared with WT mice.

