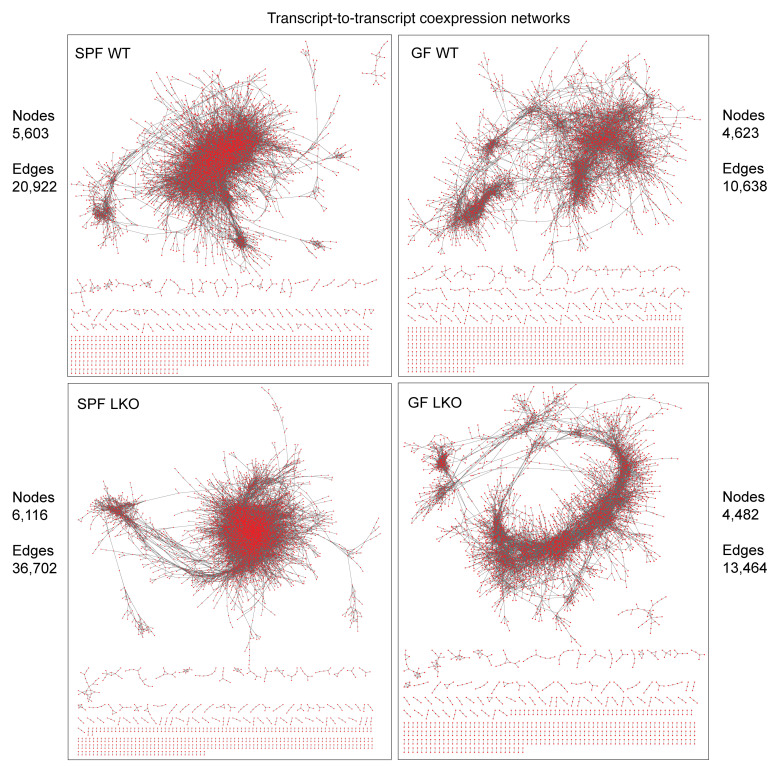
Figure 8. Hepatic transcriptome coexpression over time is differentially affected by the liver clock and gut microbes.
Network transcriptome analysis of liver samples collected every 4 hours over 24 hours from SPF and GF WT and LKO male mice (n = 3/time point/group) maintained in 12:12 LD (ZT2, -6, -10, -14, -18, and -22). Network coexpression analysis of correlating transcripts over time within each group (P < 0.001). Network visualization and the number of correlating transcripts (nodes) and connections (edges) in each group. Red dots represent nodes, and gray lines represent edges.

