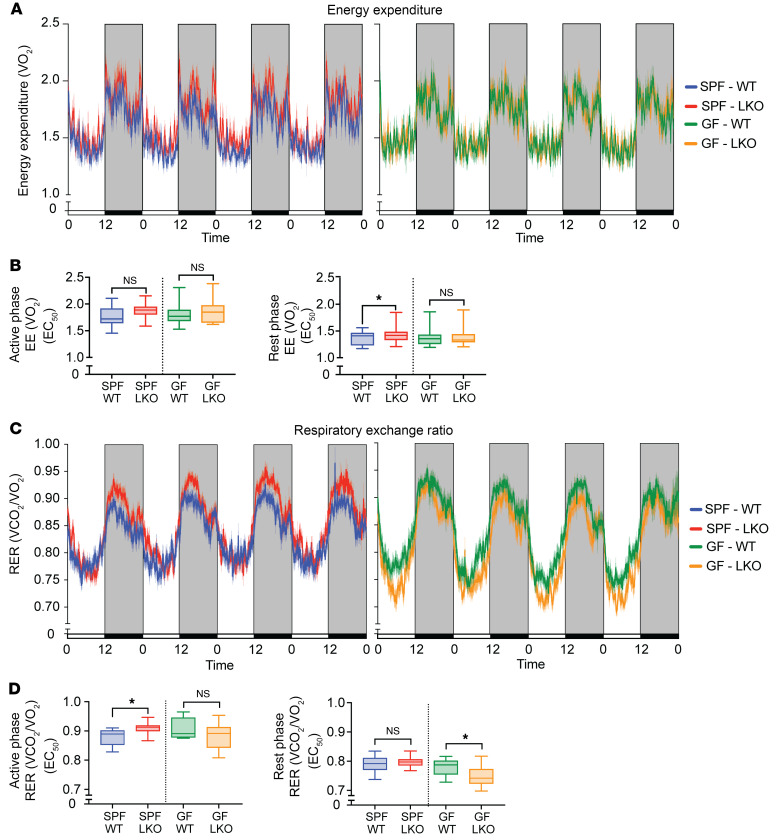
Figure 9. Liver clock and gut microbes differentially alter diurnal patterns of energy expenditure and fuel utilization.
Indirect calorimetry assessment of SPF and GF WT and LKO male mice, measured over 4 consecutive 12:12 LD cycles (n = 12–13). (A) Energy expenditure (EE) represented as VO2. (B) EE divided into active (dark) and rest (light) periods, summarized by EC50 values within each period. (C) Respiratory exchange ratio (RER) represented as VCO2/VO2. (D) RER during active (dark) and rest (light) phases, summarized by EC50 values. Data points represent mean ± SEM. Lines in box plots represent the median, and whiskers represent the minimum and maximum, respectively. ANCOVA was performed between 2 groups. *P < 0.05.

