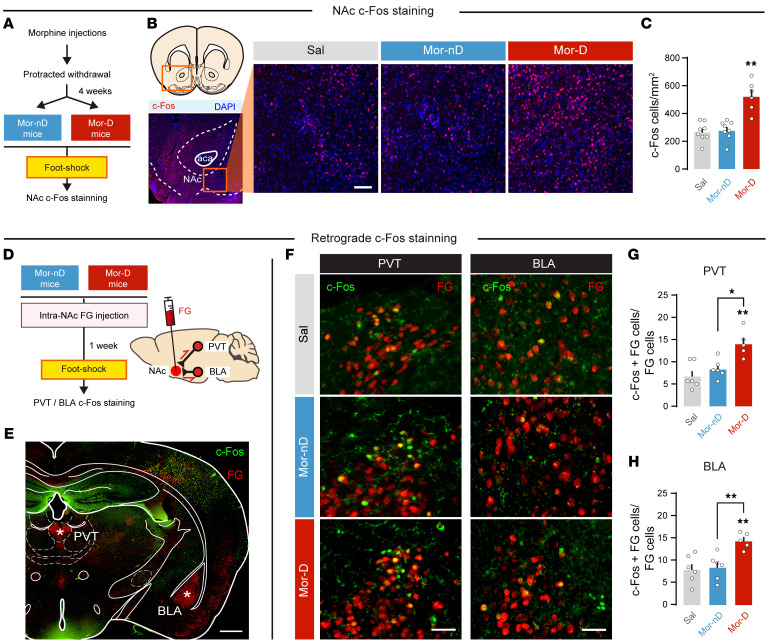
Figure 3. The BLA and PVT afferents to NAc are activated in mice with depressive-like behaviors after morphine withdrawal (Mor-D).
(A) Flowchart of NAc c-Fos staining. (B) Representative NAc c-Fos immunostaining photos. Scale bar: 200 μm. (C) Total c-Fos–positive cells in NAc. Four slices per mouse, n = 6–8 per group. **P < 0.01, by 1-way ANOVA followed by Šidák’s test. (D) Flowchart of retrograde tracer Fluorogold (FG) injection and c-Fos staining in PVT or BLA. (E) Representative photo of c-Fos and FG staining in PVT and BLA. Scale bar: 0.5 mm. (F) Representative co-immunostaining photos for c-Fos and FG. Scale bars: 100 μm. (G and H) Active c-Fos cells (c-Fos+FG to total FG cells) in PVT and BLA. Four slices per mouse, n = 5–6 per group. *P < 0.05, **P < 0.01, by 1-way ANOVA followed by Šidák’s test. Data are presented as mean ± SEM.

