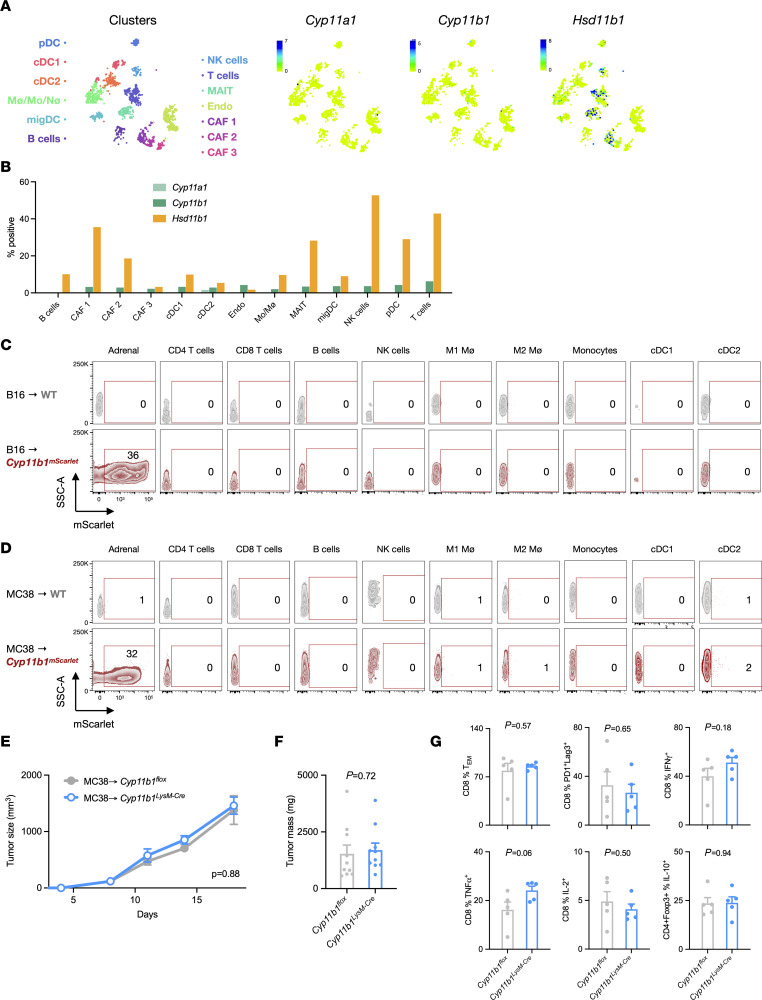
Figure 3. Lack of Cyp11b1 expression and activity in tumor-infiltrating cells.
(A) tSNE visualization of single-cell RNA profiles from mouse melanoma tumor-infiltrating cells. Data were obtained from the Wellcome Sanger mouse genomes project (https://www.sanger.ac.uk/data/mouse-genomes-project/) and visualized using the CELLxGENE platform. (B) Data from A presented as the percentages of cells within each cluster expressing any detectable transcripts of Cyp11a1, Cyp11b1, and Hsd11b1. (C and D) Flow cytometry analysis of adrenal cells and tumor-infiltrating cells from B16 cell–implanted WT and Cyp11b1mScarlet reporter mice (n = 3, 3) and MC38 cell–implanted WT and Cyp11b1mScarlet mice (n = 3,3). Representative contour plots (from left to right) show total live adrenal cells, and CD45+TCRβ+CD4+ T cells, CD45+TCRβ+CD8+ T cells, CD45+B220+ B cells, CD45+NK1.1+ NK cells, CD45+CD11b+F4/80+MHCII+ M1 macrophages, CD45+CD11b+F4/80+MHCII– M2 macrophages, CD45+CD11b+F4/80–MHCII+ monocytes, CD45+CD11c+MHCII+CD8+ cDC1, and CD45+CD11c+MHCII+CD11b+ cDC2. Numbers show the percentages of mScarlet+ cells of each subset from WT (gray) and Cyp11b1mScarlet (red) mice. (E) MC38 tumor growth in control or Cyp11b1LysM–Cre (Lyz2-Cre) mice (n = 5, 5). Representative of 2 independent experiments. (F) MC38 tumor masses in control or Cyp11b1LysM–Cre mice (n = 10, 10). Data are pooled from 2 independent experiments. (G) Tumor-infiltrating T cell phenotypes in control or Cyp11b1LysM–Cre (Lyz2-Cre) mice (n = 5, 5). Representative of 2 independent experiments. Tumor growth was analyzed using rmANOVA with mouse genotype, sex, and experiment as factors. Tumor mass and cell frequencies were analyzed using ANOVA with mouse genotype and experiment as factors. Data are represented as means ± SEM with P values indicated in each panel. Supporting data are available in Supplemental Figure 3.

