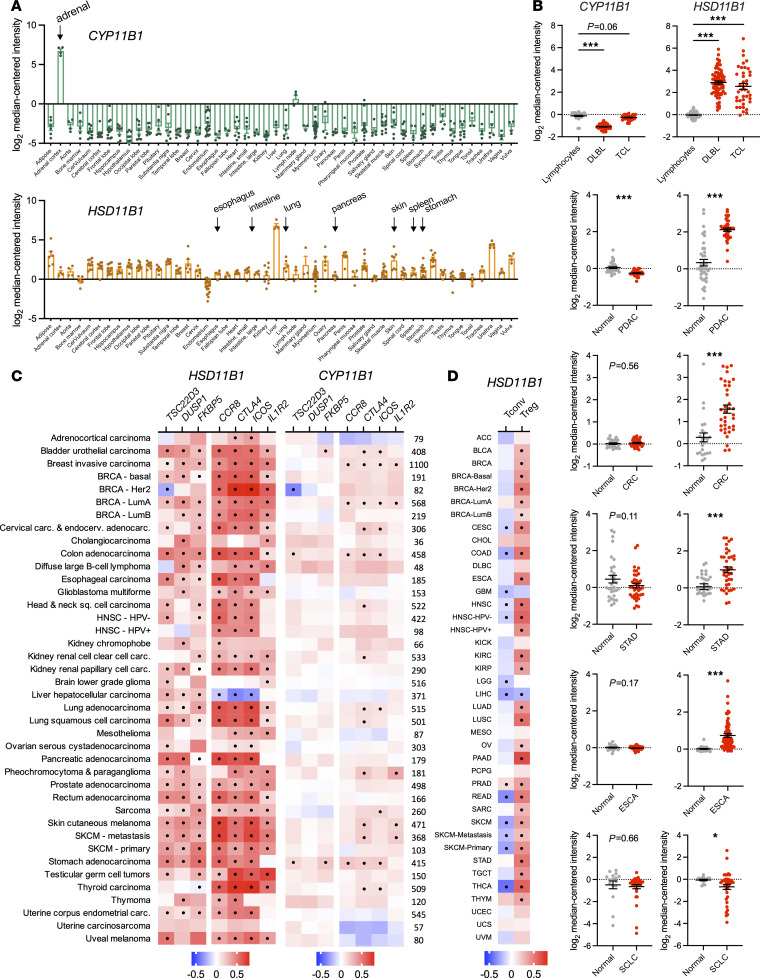
Figure 6. HSD11B1 is expressed in human tumors and correlates with expression of T cell dysfunction and immunosuppression genes.
(A) Relative gene expression of CYP11B1 and HSD11B1 in healthy adult human tissues (n = 3 to 27 per tissue). Data were acquired on Oncomine (https://www.oncomine.org/). (B) Relative gene expression of CYP11B1 and HSD11B1 in cancer versus normal tissues. Sample sizes were as follows: lymphocytes, 40; diffuse B cell lymphoma (DLBL), 70; T cell lymphoma (TCL), 40; normal pancreas, 39; pancreatic ductal adenocarcinoma (PDAC), 39; normal colon, 24; colorectal cancer (CRC), 36, normal stomach, 31; stomach adenocarcinoma (STAD), 38; normal esophagus, 28; esophageal adenocarcinoma (ESCA), 75; normal lung, 29; squamous cell lung carcinoma (SCLC), 87. Data acquired on Oncomine are represented as means ± SEM and were analyzed using ANOVA or unpaired t tests. Multiplicity-adjusted significance of *P < 0.05; ***P < 0.001. (C) Correlation between expression of CYP11B1 (left) or HSD11B1 (right) and glucocorticoid response genes (TSC22D3, DUSP1, FKBP5), and Treg marker genes (CCR8, CTLA4, ICOS, IL1R2) in human cancers. TCGA gene expression data were analyzed using TIMER2.0 and are presented as heatmaps showing the strength of the correlation (partial Spearman’s ρ) with significant correlations (P < 0.05 after adjusting for multiple comparisons) indicated with black circles. Sample sizes are shown at right. (D) Correlation between expression of HSD11B1 with bulk RNA-Seq estimated frequency of tumor-infiltrating Tconvs and Tregs. TCGA gene expression data were analyzed using the quanTIseq algorithm on TIMER2.0 and are presented as heatmaps showing the strength of the correlation (partial Spearman’s ρ) with significant correlations (P < 0.05 after adjusting for multiple comparisons) indicated with black circles. Sample sizes are the same as in D. Supporting data are available in Supplemental Figure 6.

