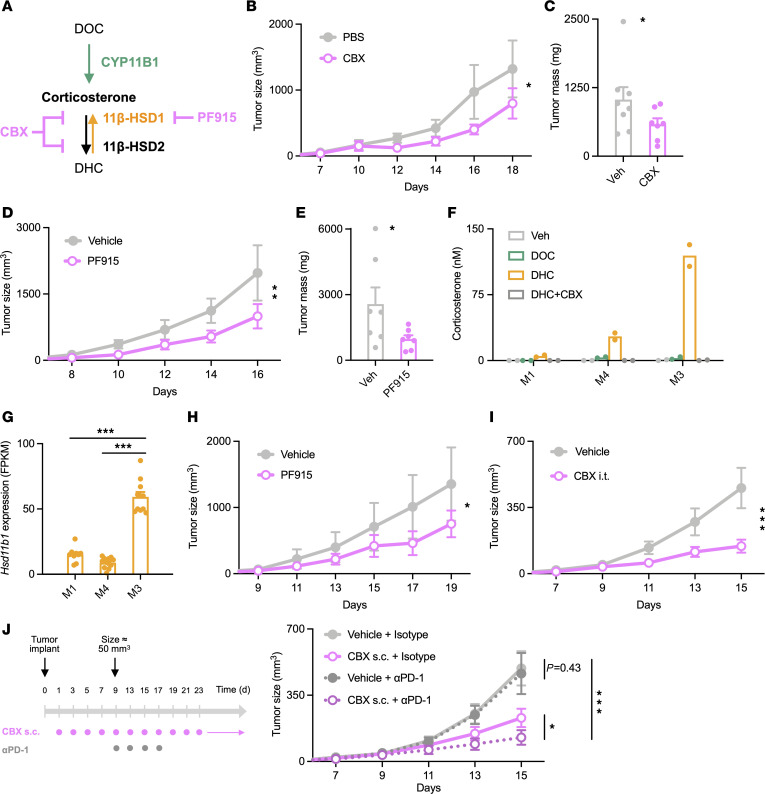
Figure 7. Pharmacological inhibition of 11β-HSD1 reduces tumor growth.
(A) Inhibition of glucocorticoid generation by carbenoxolone and PF-915275. (B) B16 tumor growth in WT mice treated daily (beginning 24 hours after implant) with 50 mg/kg carbenoxolone or PBS (200 μL subcutaneous) (n = 3, 4). Representative of 2 experiments. (C) B16 tumor masses in PBS- or carbenoxolone-treated mice (n = 8, 7). Data pooled from 2 experiments. (D) B16 tumor growth in mice treated daily with 50 mg/kg PF-915275 or vehicle (200 μL subcutaneous) (n = 4, 4). Representative of 2 experiments. (E) B16 tumor masses in vehicle- or PF-915275–treated mice (n = 7, 7). Data pooled from 2 experiments. (F) Corticosterone production by 5 × 10⁴ M1, M4, or M3 mouse melanoma cells cultured 45 minutes with 100 μM carbenoxolone and then overnight with 100 nM DOC or DHC. Corticosterone in supernatants was quantified via immunoassay. Data show duplicate samples and are representative of 2 experiments. (G) RNA-Seq data from M1, M4, and M3 cells (n = 9, 12, 11 samples) (51) analyzed for relative Hsd11b1 expression. (H) M3 tumor growth in mice treated daily with 50 mg/kg PF-915275 or vehicle (200 μL subcutaneous) (n = 4, 4). Representative of 2 experiments. (I) M3 tumor growth in WT mice treated with 6.25 mg/kg carbenoxolone or vehicle (50 μL intratumoral) (n = 7, 7) every 2 days (beginning day 9) for a total of 5 treatments. Representative of 2 experiments. (J) M3 tumor growth in mice treated daily with 6.25 mg/kg carbenoxolone or vehicle (200 μL subcutaneous) and treated with 10 mg/kg anti–PD-1 or rat IgG2a isotype control (200 μL intraperitoneal). Vehicle/isotype, n = 10; vehicle/anti–PD-1, n = 10; carbenoxolone/isotype, n = 12; carbenoxolone anti–PD-1, n = 10 mice. Tumor growth was analyzed using rmANOVA with treatment and sex as factors. Tumor masses were analyzed using ANOVA with treatment, sex, and experiment as factors. Data are shown as mean ± SEM. *P < 0.05; **P < 0.01; ***P < 0.001.

