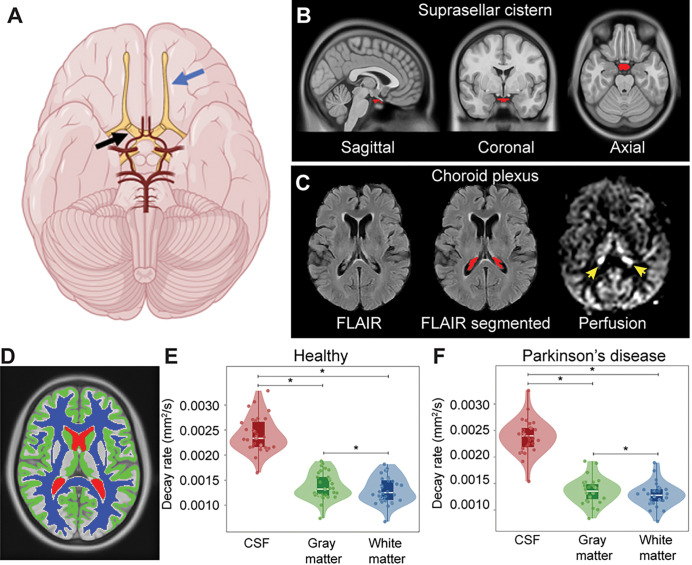
Figure 2. Localization and segmentation of imaging regions.
(A) Suprasellar cistern location, which co-localizes with major cranial nerves including the olfactor (blue arrow) and optic (black arrow), along with circle of Willis (red vasculature). (B) Suprasellar cistern region of interest used in all participants overlaid on the standard 1 mm brain atlas. (C) Choroid plexus at the level of the lateral ventricles visible on FLuid Attenuated Inverstion Recovery (FLAIR) MRI, along with example of segmentation; the perfusion map is shown to right, which highlights (yellow arrows) the high choroid plexus perfusion signal which is comparable to gray matter perfusion signal. Given the high variability in choroid plexus anatomy, structures were segmented in native space for each participant using previously-reported machine learning routines (see Methods). (D) Example of tissue segmentation used to confirm abilities to evaluate differences in neurofluid and tissue motion. (E-F) Separately in each group, decay rates are significantly elevated in cerebrospinal fluid (CSF) relative to other tissue types (p<0.001), a well as in gray matter relative to white matter (p<0.001). The plots show boxplots overlaid on violin plots, with all participant data plotted as separate data points for completeness. See Table 1 for quantitative values. * p<0.001.

