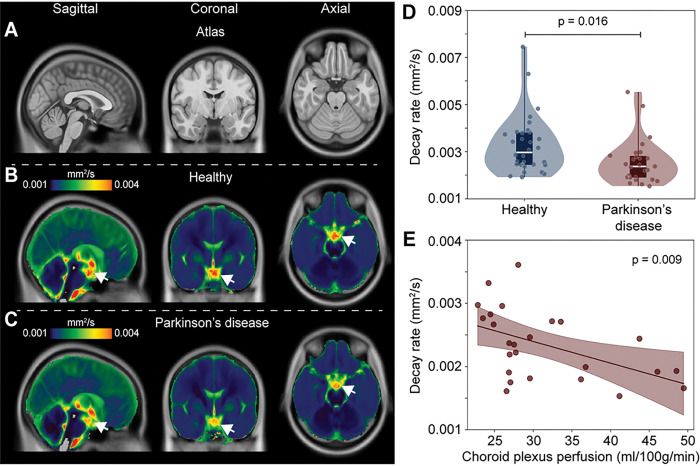
Figure 3. Group-averaged maps of decay rates in healthy participants and participants with Parkinson’s disease (PD).
Reduced supracellar flow is observed in PD relative to healthy participants (A-C). (D) Violin plots showing the distribution of suprasellar cistern decay rates in healthy vs. PD participants, suggesting reduced suprasellar cistern neurofluid motion in PD (p=0.016). The plots show boxplots overlaid on violin plots, with all participant data plotted as separate data points for completeness. (E) In PD participants only, reduced decay rates, indicative of slower neurofluid flow, are associated with higher choroid plexus perfusion values.

