
Figure 3.
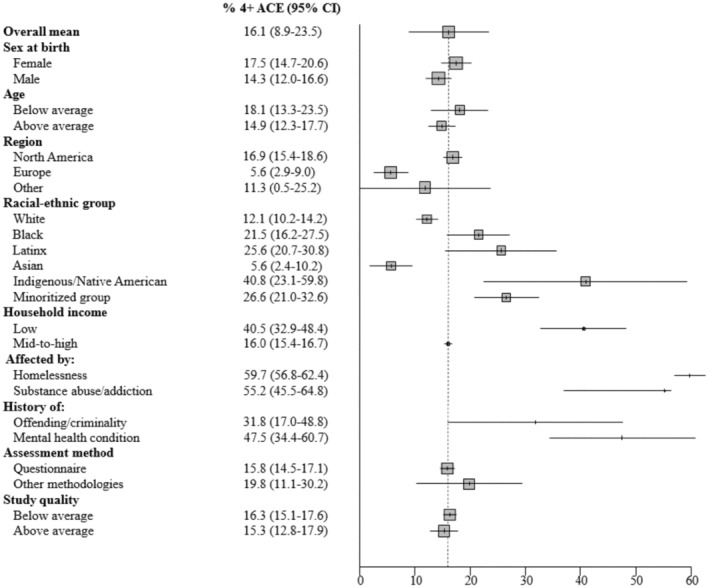
Forest plot of the prevalence of 4+ adverse childhood experiences (ACEs). The overall mean prevalence of 4+ ACEs is displayed alongside the mean prevalence of 4+ ACEs for different levels of categorical moderators, and below and above average values for continuous moderators. Error bars represent 95% CIs.