
Figure 4.
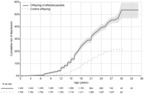
Meta‐analytic Kaplan‐Meier curve summarizing the cumulative incidence of DSM/ICD depressive disorders in offspring of parents affected with those disorders (n=5) and control offspring (n=6). The shade in the curve represents 95% CI.
Official websites use .gov
A
.gov website belongs to an official
government organization in the United States.
Secure .gov websites use HTTPS
A lock (
) or https:// means you've safely
connected to the .gov website. Share sensitive
information only on official, secure websites.
Meta‐analytic Kaplan‐Meier curve summarizing the cumulative incidence of DSM/ICD depressive disorders in offspring of parents affected with those disorders (n=5) and control offspring (n=6). The shade in the curve represents 95% CI.