
Figure 5.
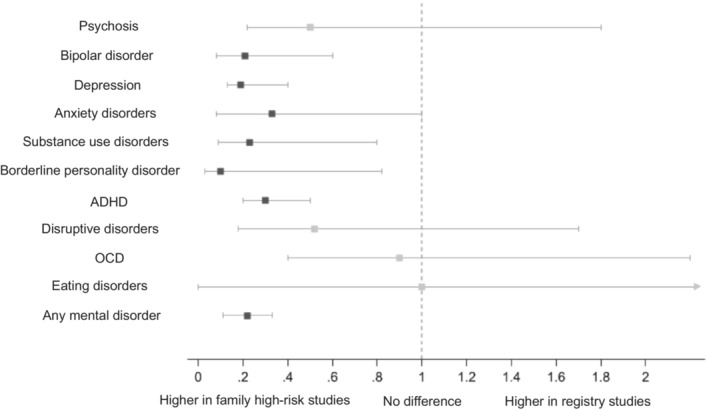
Comparison of the risk of mental disorders reported in registry studies vs. family high‐risk studies. For each mental disorder in offspring, the square shows the estimate and the horizontal line the 95% CI of the registry to family high‐risk ratio. Significant ratios are shown in dark grey squares; non‐significant ratios in pale grey squares. ADHD – attention‐deficit/hyperactivity disorder, OCD – obsessive‐compulsive disorder.