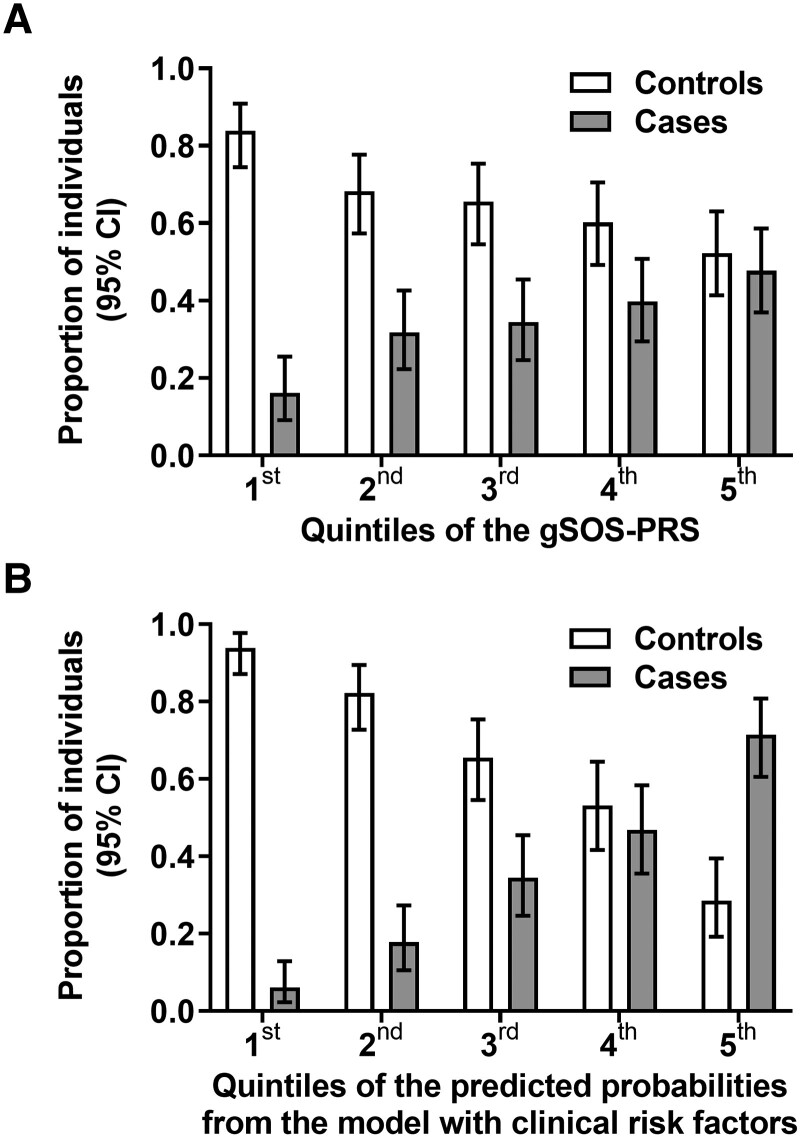
Figure 2.
Distribution of PRSs and clinical risk factors in 289 controls without osteopenia or osteoporosis and 149 cases with osteoporosis. We divided study participants into cases and controls and into 5 quintiles according to their individual gSOS PRSs and clinical risk factors combined. Proportion and 95% CI of cases and controls are presented per quintile. A, Distribution of osteoporosis cases and controls according to quintiles of the gSOS PRS. There were 14 (16.1%) cases vs 73 (83.9%) controls in the first quintile (most favorable), 28 (31.8%) vs 60 (68.2%) in the second, 30 (34.5%) vs 57 (65.5%) in the third, 35 (39.8%) vs 53 (60.2%) in the fourth, 42 (47.7%) vs 46 (52.3%) in the fifth (least favorable). B, Distribution of osteoporosis cases and controls according to quintiles of clinical risk. There were 6 (6.1%) cases vs 92 (93.9%) controls in the first quintile (most favorable), 16 (17.8%) vs 74 (82.2%) in the second, 30 (34.5%) vs 57 (65.5%) in the third, 37 (46.8%) vs 42 (53.2%) in the fourth, 60 (71.4%) vs 24 (28.6%) in the fifth (least favorable). gSOS, genetically predicted heel quantitative ultrasound speed of sound; PRS, polygenic risk score.

