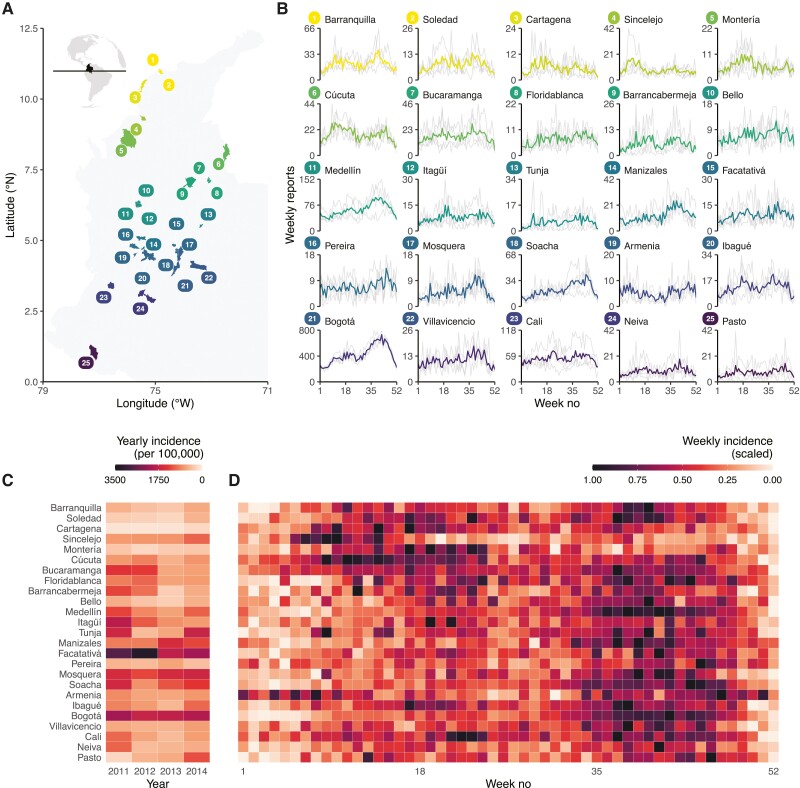
Figure 1.
Varicella reports and incidence of varicella in Colombia, 2011–2014. (A) Map of included municipalities. (B) Mean weekly varicella reports in the municipalities of Colombia: lighter lines show the weekly reports every year. (C) Mean yearly varicella incidence per 100 000 children ≤10 years of age per municipality, and (D) mean weekly varicella incidence of varicella per municipality (rescaled so that 0 is the minimum and 1 is the maximum number of cases per municipality). From bottom to top, the municipalities are ordered by increasing latitude.

