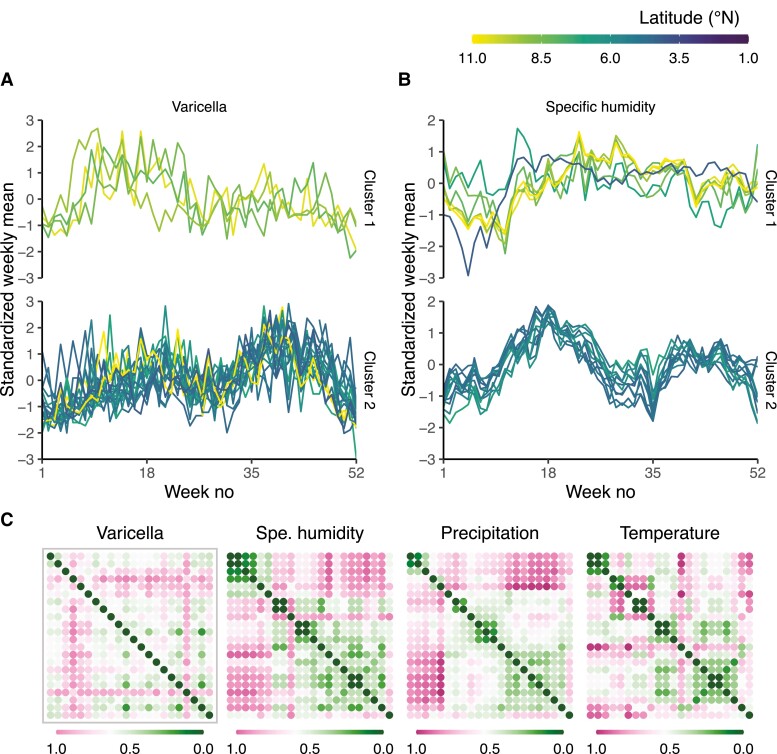
Figure 3.
Correlation between spatial heterogeneity of varicella seasonality and that of climatic variables. Standardized weekly mean varicella reports (A) and specific humidity (B) independently clustered in 2 municipality groups. (C) Between-municipality dissimilarity (based on Euclidean distance) matrices of varicella, specific humidity, precipitation, and temperature (from bottom to top and left to right, the municipalities are ordered by increasing latitude).

