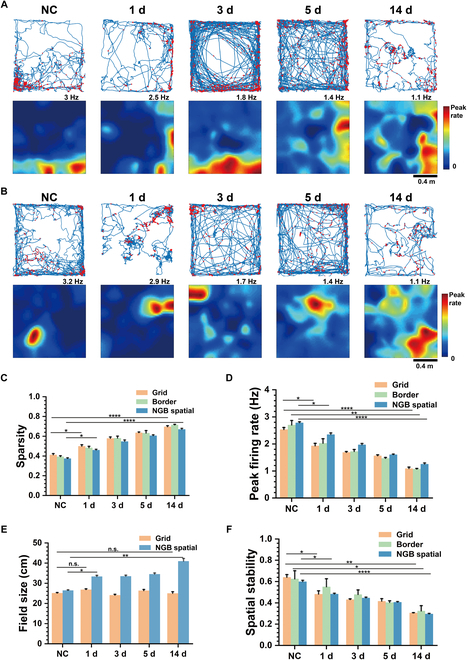
Fig. 2.

The decline of spatial representations with the duration of TLE for all types of spatial cells. (A) Increasingly dispersed spatial firing patterns of border cells from NC to TLE 14 d shown in trajectory maps with red spike position dots (top) and firing rate maps (bottom). (B) Increasingly dispersed spatial firing patterns of NGB spatial cells from NC to TLE 14 d shown in trajectory maps with red spike position dots (top) and firing rate maps (bottom). (C) The sparsity of grid, border, and NGB spatial cells gradually increases from NC to TLE 14 d (unpaired t test, *P < 0.05, ****P < 0.0001). (D) The peak firing rates of grid, border, and NGB spatial cells gradually reduce from NC to TLE 14 d (unpaired t test, *P < 0.05, **P < 0.01, ****P < 0.0001). (E) The field sizes of NGB spatial cells gradually increase from NC to TLE 14 d, but those of grid cells are comparable (unpaired t test, *P < 0.05, **P < 0.01). (F) The spatial stabilities of grid, border, and NGB spatial cells gradually reduce from NC to TLE 14 d (unpaired t test, *P < 0.05, **P < 0.01, ****P < 0.0001).
