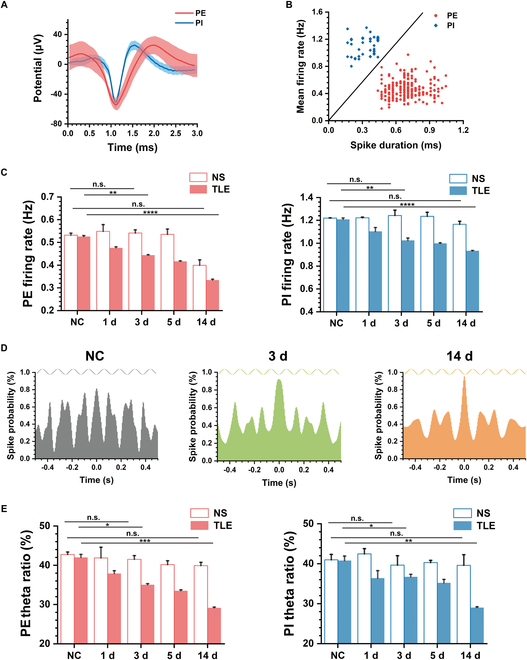
Fig. 3.

Electrophysiological characteristics of putative excitatory (PE) neurons and putative inhibitory (PI) neurons in MEC between TLE and NS. (A) Examples of mean spike waveforms of both PE and PI. (B) Mean firing rates of all recording cells versus spike duration, with PE and PI classified into 2 clusters (n = 253 cells). (C) Statistics of mean firing rate of recorded PE (left) and PI (right) from NC to 14 d between NS and TLE (unpaired t test, **P < 0.01, ****P < 0.0001). (D) Spike time autocorrelations of example recording cells in NC, TLE 3 d, and TLE 14 d, which exhibit the gradually decreased periodic peaks fit with sine wave at 8 Hz. (E) Statistics of theta ratio of spike PSD of recorded PE (left) and PI (right) from NC to 14 d between NS and TLE (unpaired t test, *P < 0.05, **P < 0.01, ***P < 0.001).
