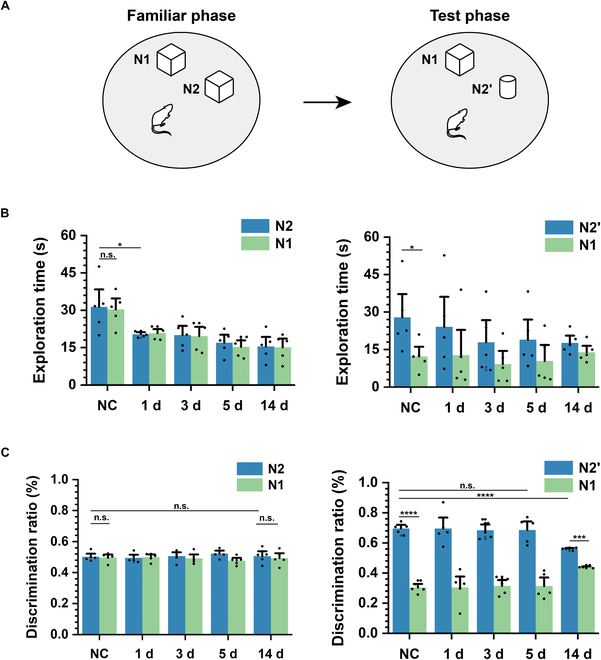
Fig. 5.

Impaired performance of TLE rats in the novel object recognition experiment. (A) Schematic diagrams of the novel object recognition experiment, which contain the familiar phase and the test phase. (B) Exploration time for 2 objects in the familiar phase (left) and the test phase (right) from NC to TLE 14 d (n = 5; paired t test, *P < 0.05, **P < 0.01). (C) Discrimination ratio for 2 objects in the familiar phase (left) and the test phase (right) from NC to TLE 14 d (n = 5; paired t test, ***P < 0.001, ****P < 0.001).
