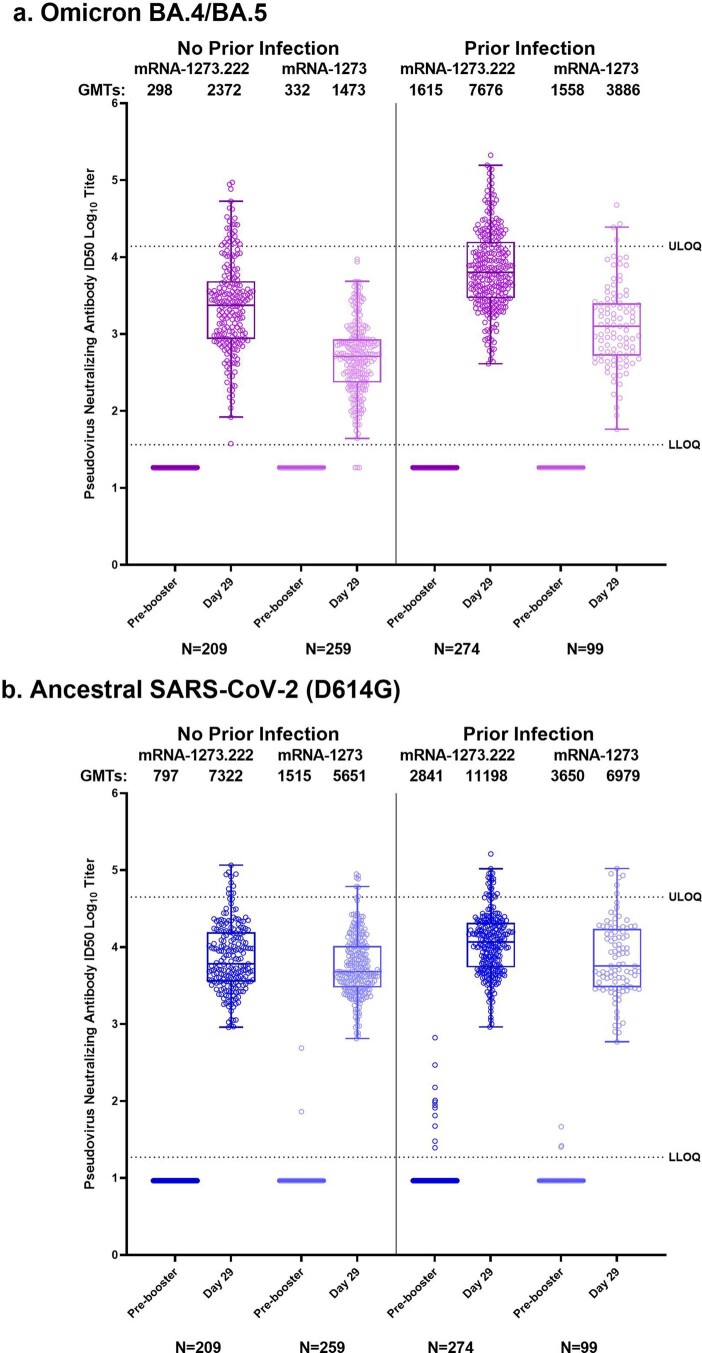
Extended Data Fig. 1. Distribution of Observed Neutralizing Antibody Titers.
Distribution of neutralizing antibody titers (ID50 log10) in the pseudovirus assay against Omicron BA.4/BA.5 (Panel A) and ancestral SARS-CoV-2 (D614G) (Panel B) are shown for serum samples collected before the second booster dose of 50-µg of mRNA-1273.222 or 50-µg of mRNA-1273 (prebooster), and at 28 days after the second booster dose (day 29) in those with and without prior SARS-CoV-2 infection. The circles are values from individual serum samples. Pseudovirus neutralizing antibody assay lower limits of quantification (LLOQ) are 18.5 (1.3 log10) for ancestral SARS-CoV-2 [D614G] and 36.7 (1.6 log10) for Omicron BA.4/BA.5; upper limits of quantification (ULOQ) are 45,118 (4.7 log10) for ancestral SARS-CoV-2 [D614G] and 13,705 (4.1 log10) for Omicron BA.4/BA.5. Boxes and horizontal bars denote interquartile (IQR) ranges and median endpoint titers; whisker endpoints are the maximum and minimum values below or above the median ±1.5 times the IQR. Refer to Table 2 for the observed geometric mean titers and geometric mean fold-rises, and the estimated neutralizing antibody geometric mean titers and geometric mean ratios (ANCOVA model-based) following the second booster doses of 50-µg mRNA-1273 or 50-µg of mRNA-1273.214.

