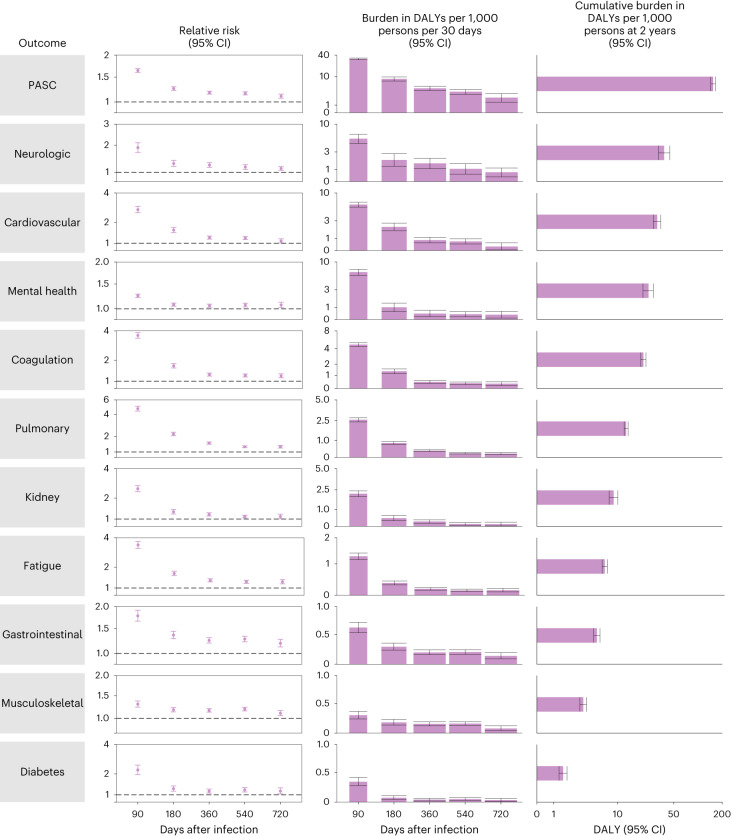
Fig. 6. Risk and DALYs of postacute sequelae overall and by organ system in COVID-19 overall.
The first column includes risk of the outcome due to COVID-19 by time periods of 30–90, 91–180, 181–360, 361–540 and 541–720 days after infection. The dot represents the relative risk, while the error bars correspond to the 95% confidence intervals. The second column includes the DALYs rate per 1,000 persons per 30 days by time period. The center of the vertical bar represents the DALYs rate, while the error bars correspond to the 95% confidence intervals. Bar widths differ by the duration of the time period. The third column presents the cumulative DALYs per 1,000 persons during the postacute phase at 2 years after infection. The center of the horizontal bar represents the cumulative DALYs rate, while the error bars correspond to 95% confidence intervals. No adjustment for multiple comparisons was made for the prespecified analyses. Outcomes are ordered from top to bottom by the largest cumulative DALYs at 2 years after infection. The horizontal bar represents the cumulative DALYs rate, while the error bars correspond to the 95% confidence intervals. Overall COVID-19 (n = 138,818) and control group (n = 5,985,227).

