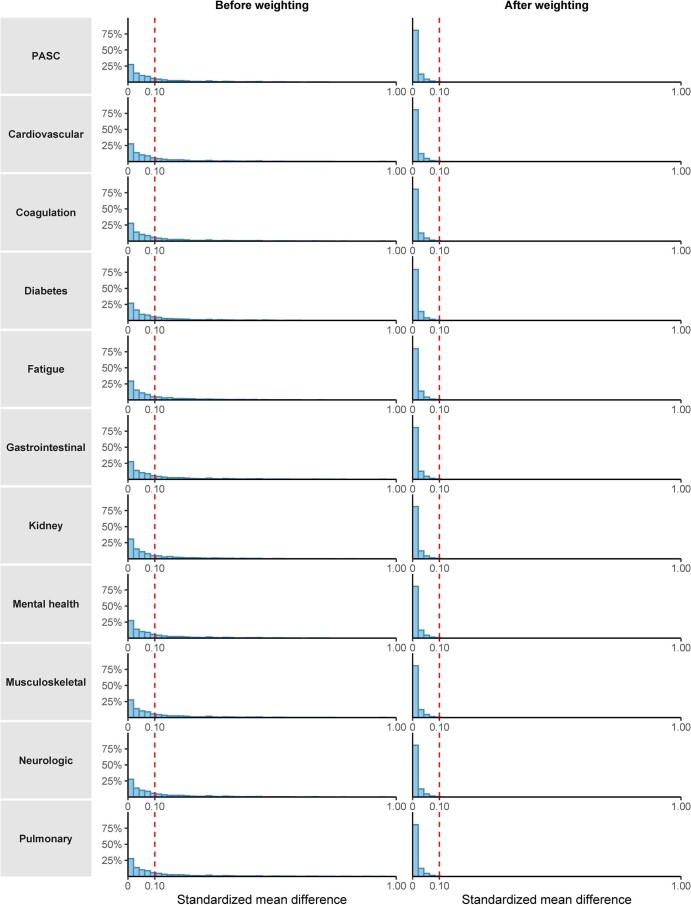
Extended Data Fig. 2. Standardized mean differences between COVID-19 non-hospitalized, hospitalized, and control before and after weighting in analyses of post-acute sequelae (PASC) and sequelae by organ system.
Plots includes the standardized mean difference (SMD) (x-axis) and the percent distribution (y-axis), for analyses of post-acute sequelae and sequelae by organ system. Includes differences for non-hospitalized compared to the control, hospitalized compared to the control, and non-hospitalized compared to hospitalized. Covariates examined included pre-defined covariates, algorithmically selected high dimensional covariates, and non-selected high dimensional covariates. An SMD > 0.1 (dotted red line) was taken as evidence of imbalance. After weighting, no SMD were > 0.1.

