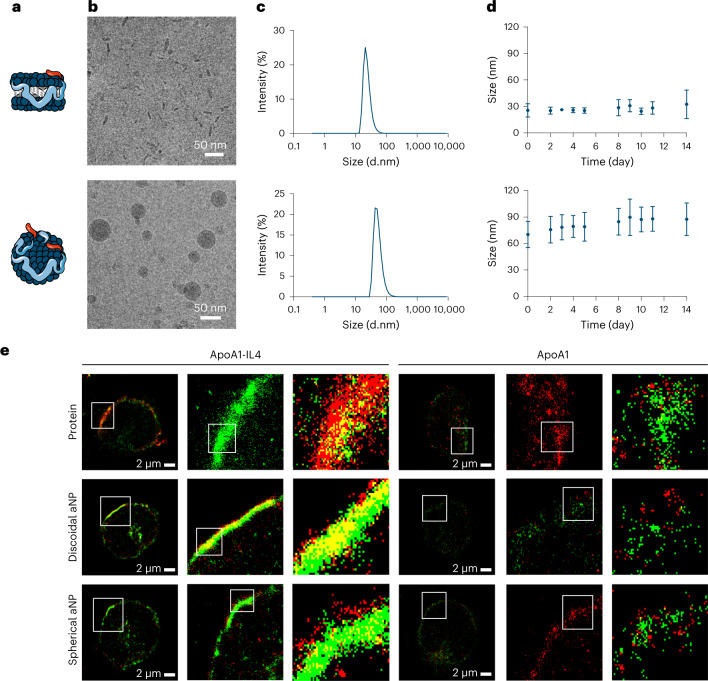
Fig. 4. Integrating apoA1–IL4 in nanoparticles.
a,b, Schematic representation (a) and cryo-TEM images (b) of discoidal (upper panel) and spherical IL4-aNPs (lower panel). c,d, IL4-aNP size distribution (c) and stability (d) of IL4-aNPs over time as determined by DLS. IL4-aNP size is reported as the number mean. e, Super-resolution fluorescence microscopy (dSTORM) images of human monocytes incubated with either fluorescently labelled apoA1(-IL4) or (IL4-)aNPs (red) and stained with anti-IL4Rα antibody (green). The co-localization between the proteins and IL4Rα can be appreciated in yellow. White ROIs are magnified in subsequent images on the right. Data are presented as mean ± s.d.

