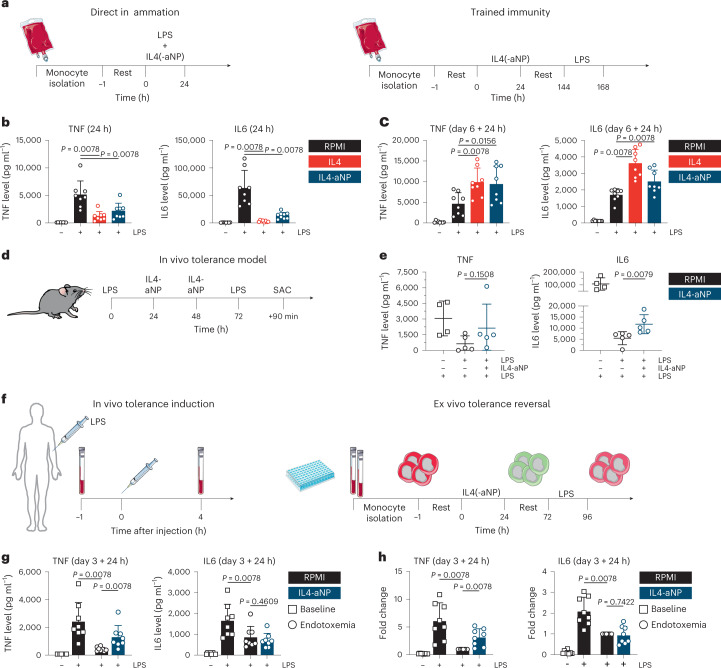
Fig. 6. Immunological in vitro, in vivo and ex vivo therapeutic evaluation of IL4-aNPs.
a, Schematic overview of the direct inflammation and trained immunity experiments in vitro. b. TNF and IL6 levels after 24 h stimulation of monocytes in the presence of IL4-aNPs. c, TNF and IL6 levels after re-stimulation of IL4(-aNP)-trained cells. d, Schematic overview of murine in vivo tolerance model, including IL4-nanotherapy. e, Serum TNF and IL6 levels following LPS re-challenge of mice treated with IL4m-aNPs. The Mann–Whitney U test was used for statistical comparisons. f, Schematic overview of human experimental endotoxaemia model, including ex vivo tolerance reversal. g, TNF and IL6 levels after ex vivo re-stimulation of human in vivo LPS-tolerized cells. h, TNF and IL6 fold increase after ex vivo re-stimulation of human in vivo LPS-tolerized cells. Data are presented as mean ± s.d.

